
Figure 13.
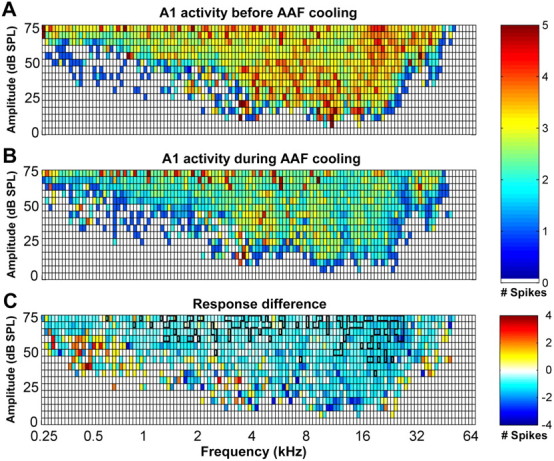
Mean response strength of A1 neurons to specific tonal stimuli before (A) and during (B) AAF deactivation. The color of each square in the table represents the average number of spikes evoked at the corresponding frequency–intensity combination. C, Subtraction of the response strength of A1 before AAF deactivation (A) from the response strength of A1 during AAF deactivation (B). Note that the decrease in driven activity of A1 cells during AAF cooling deactivation is uniform throughout the frequency–intensity domain. No change is represented by white boxes. In C, regions circumscribed by the thick black lines indicate statistically significant changes at p < 0.05; n = 79.