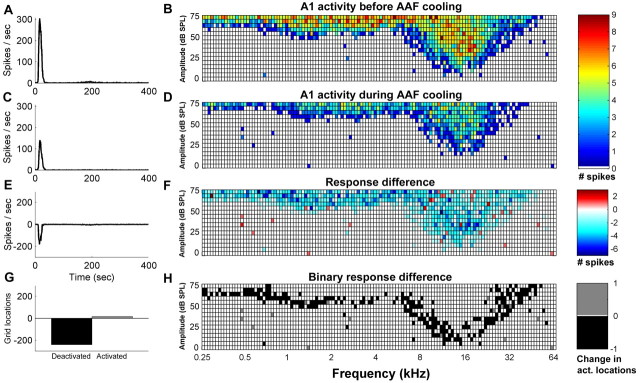
Figure 5.
Representative neuronal activity changes recorded from a single site in A1 before and during cooling deactivation of AAF. Peristimulus time histograms and corresponding receptive fields of a recording site located in A1 before (A, B) and during (C, D) AAF cooling. Subtraction of A1 activity recorded before AAF cooling from the activity of the same neuron during AAF cooling (E, F). Binary subtraction of active locations recorded in A1 during normal AAF activity from active locations recorded during AAF deactivation (G, H). Note that black squares indicate locations that were activated by tonal stimulation in A1 during periods of AAF normal activity but not during periods of AAF cooling deactivation.

