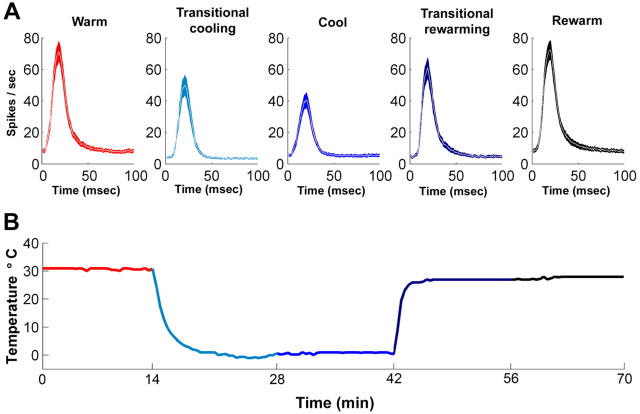
Figure 6.
A, A1 neuronal activity during the five stages of AAF cooling deactivation. B, Temperature changes recorded at the cooling loop during a complete deactivation cycle. The colors of the panels in A match the colors of B and indicate the times during which the peristimulus time histograms were recorded. Note the massive decrease in activity during the cool condition (dark blue) compared with the activity recorded during the warm (red) and rewarm (black) conditions in A. Also note that the PSTHs recorded during the warm and rewarm conditions show a striking resemblance to each other.

