Figure 1.
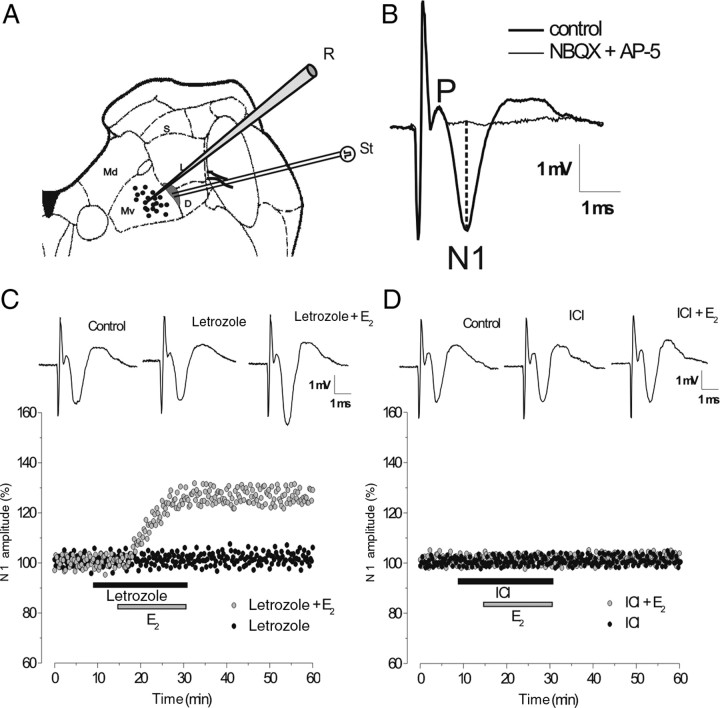
The effects of letrozole and ICI 182,780 on evoked FP. A, Schematic drawing of a brainstem slice showing recording (black circles) and stimulation (gray area) sites in the ventral portion of the MVN. D, Descending vestibular nucleus; Md, dorsal part of the MVN; MV, ventral part of the MVN; L, lateral vestibular nucleus; S, superior vestibular nucleus; R, recording; St, stimulating electrodes. B, Typical vestibular FP recorded in the Mv before and during infusion of AMPAR and NMDAR antagonists (NBQX + AP-5). P and N1, Presynaptic and postsynaptic FP components, respectively. The dashed line shows how N1 peak negative voltage was calculated compared with the baseline. C, D, Time courses of the drug effects on the amplitude of the N1 wave in the single experiments. C, Letrozole alone (black circles) and E2 with letrozole (gray circles). D, ICI alone (black circles) and E2 with ICI (gray circles). In this figure and the ones that follow, the N1 wave is expressed as a percentage of baseline and the bars show the drug infusion time. Inserts in C and D show the effects of drugs on FP.

