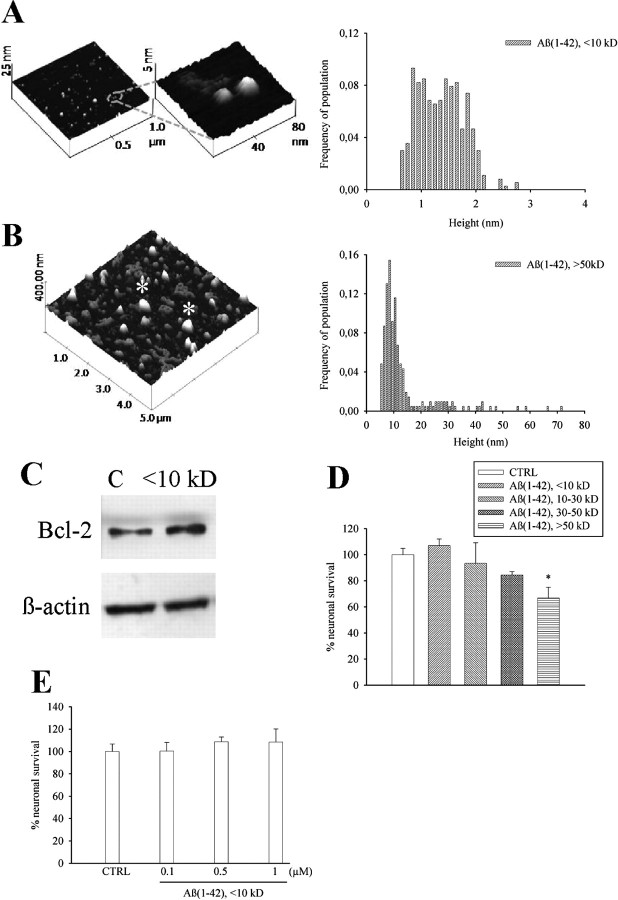
Figure 1.
Aβ1-42 monomers: separation, characterization, and lack of neurotoxicity in culture. A, B, AFM images of low-mass (<10 kDa, A) and high-mass (>50 kDa, B) Aβ1-42 species isolated from a single suspension by cutoff filters. The respective frequencies of species in the two samples are shown on the right side. The monomer fraction consisted primarily of small globules 1.3 nm in height (mean ± SD: 1.36 ± 0.42, n = 365). In contrast, the oligomer fraction consisted of larger globules 13 nm in height (mean ± SD: 13.5 ± 10.8, n = 207). In B, the asterisk indicates structures derived from the aggregation of several oligomer species which were excluded from the statistics. C, Representative Western blot image of Bcl-2 bands in control cultures (C) and cultures treated with <10 kDa Aβ1-42 for 6 h. β-Actin bands are shown for control of loading. Quantitation of Bcl-2/β-actin ratios was as follows: control (C) = 0.7 ± 0.1; <10 kDa Aβ1-42 = 1.2 ± 0.03* (means ± SEM of three independent experiments; *significantly different from control at p < 0.05 by Student's t test). Viability of pure cortical neurons, as measured by MTT assay, following 48 h treatment with different Aβ1-42 fractions (all at 0.1 μm) or different concentrations of <10 kDa Aβ1-42, is shown in D and E, respectively. Values are means ± SEM of eight determinations from two independent experiments. *p < 0.05 (one-way ANOVA + Fisher's LSD) compared with control (CTRL).

