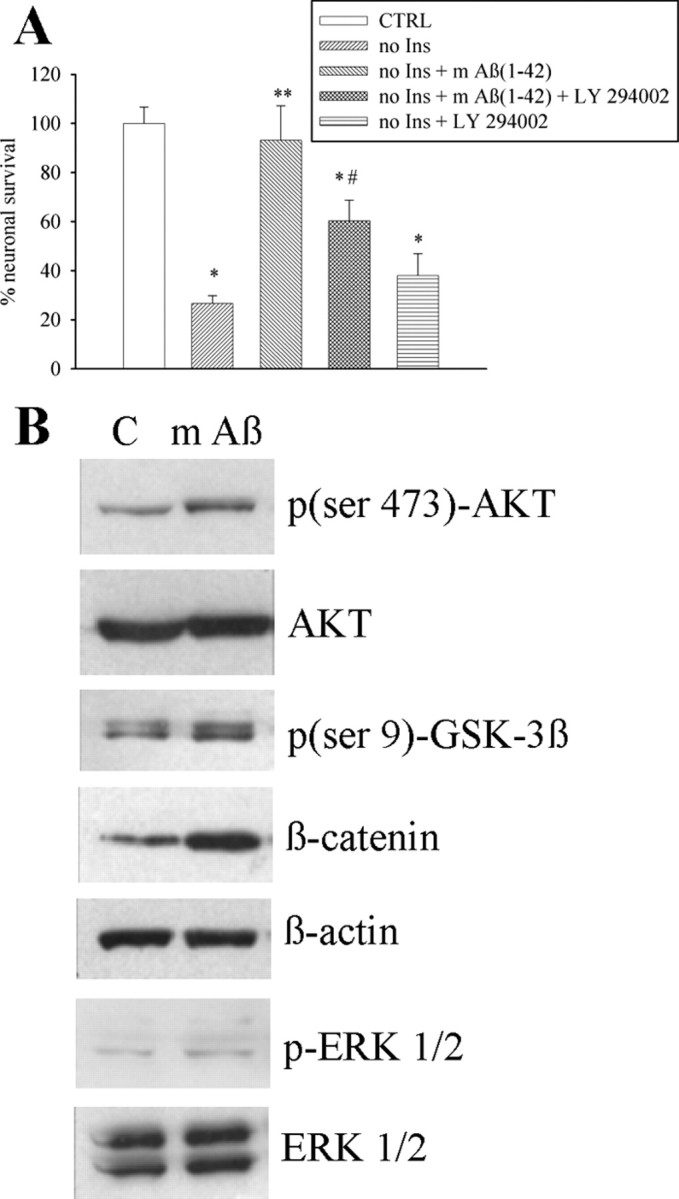
Figure 2.

Aβ1-42 monomers support neuronal survival via the activation of the PI-3-K pathway. A, Viability of pure cortical neurons, as measured by MTT assay, insulin-deprived since plating for 1 week (no Ins), in the absence or presence of 0.1 μm Aβ1-42 monomers [m Aβ(1-42)]. Where required, the PI-3-K inhibitor, LY294002 (10 μm), was added two times (at plating and after 48 h). Values are means ± SEM of six determinations from two independent experiments. *,**,#Different from control (CTRL) (*), no Ins (**), or no Ins + m Aβ1-42 (#) at p < 0.05 by one-way ANOVA + Fisher's LSD test. B, Representative Western blot images of the PI-3-K-activated form of the serine-threonine kinase AKT [p(ser 473)-AKT], of the corresponding inactivated GSK-3β [p(ser 9)-GSK-3β], and of β-catenin levels in control cultures (C) and cultures treated with 0.1 μm monomeric Aβ1-42 (m Aβ) for 10 min. Levels of phosphorylated ERK1/2 (pERK1/2) in the same cultures are also shown. Total AKT levels, β-actin bands, or total ERK levels are shown for control of loading. Quantitation of p(ser 473)-AKT/AKT ratios was as follows: control (C) = 0.26 ± 0.04; mAβ1-42 = 0.65 ± 0.1* (means ± SEM of three independent experiments; *significantly different from control at p < 0.05 by Student's t test). Quantitation of p(ser 9)-GSK-3β/GSK-3β ratios was as follows: control (C) = 0.88 ± 0.15; mAβ1-42 = 1.44 ± 0.08* (means ± SEM of three independent experiments; *significantly different from control at p < 0.05 by Student's t test). Quantitation of β-catenin/β-actin ratios was as follows: control (C) = 0.47 ± 0.05; mAβ1-42 = 1.3 ± 0.09* (means ± SEM of three independent experiments; *significantly different from control at p < 0.05 by Student's t test). Quantitation of pERK 1/2/ERK 1/2 ratios was as follows: control (C) = 0.6 ± 0.08; mAβ1-42 = 0.55 ± 0.12. (means ± SEM of three independent experiments).
