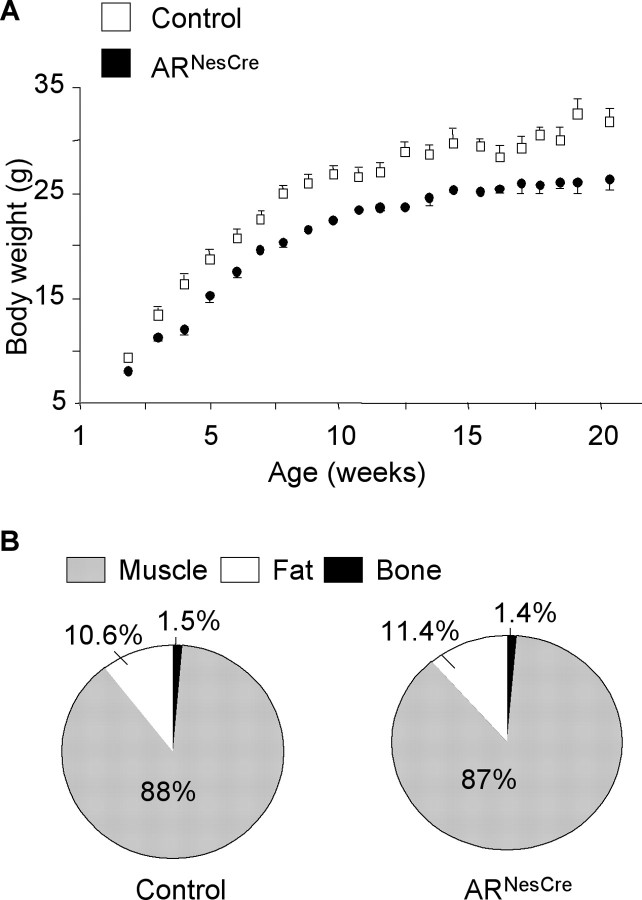
Figure 3.
Growth of ARNesCre mice. A, Control and ARNesCre males from the same litters (n = 15–19 per genotype) were weekly weighed. The growth curves are significantly different (p < 0.05). B, Body composition of live adult (3 months old) males (n = 5 per genotype) was analyzed by using a Piximus densitometer (Lunar Corporation). Muscle, fat, and bone masses are given as percentages of total body weight.

