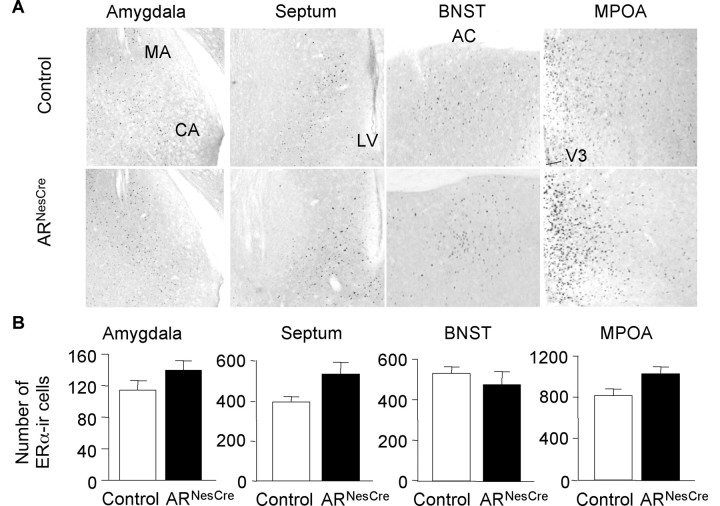
Figure 8.
Quantification of ERα-IR neurons in chemoresponsive brain areas of control and ARNesCre mice. A, Representative anti-ERα immunostaining in amygdala, septum, BNST, and MPOA. CA, Cortical amygdala; LV, lateral ventricle; AC, anterior commissure; V3, third ventricle. B, Quantitative data (n = 3–6 per genotype) expressed as ERα-positive cells per unit area.

