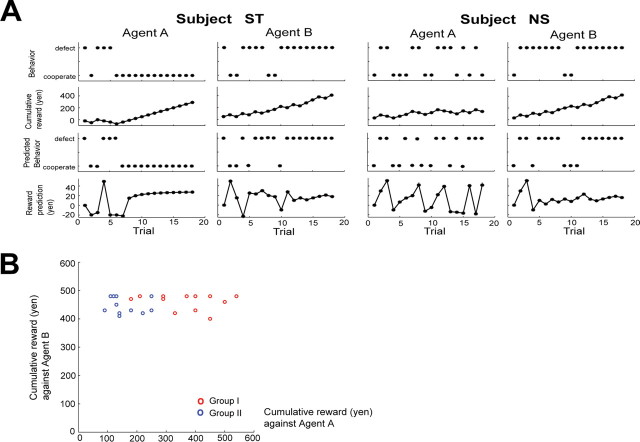
Figure 2.
Behavioral data. A, Behavior of two typical subjects. First two rows from top illustrate actions taken by subject and cumulative reward. Bottom two rows plot actions predicted by the model and estimated reward prediction during series of trials. B, Cumulative reward of subjects. Cumulative reward obtained against agents A and B is plotted for group I in red and in blue for group II.

