
Figure 2.
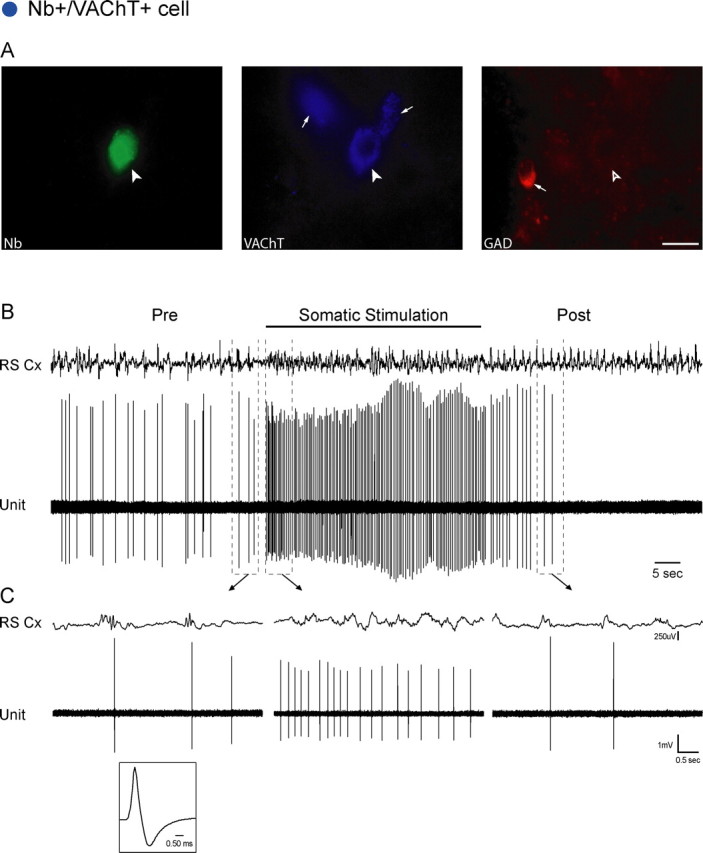
Nb+/VAChT+ cell. A, The Nb-labeled cell (filled arrowhead, #ABS80a) was positively immunostained for VAChT (filled arrowhead) and negatively for GAD (open arrowhead), while near other VAChT+ and GAD+ cells in the region (small arrows). Scale bar, 20 μm. The cell was located in the SubLDT (largest blue circle) (Fig. 1, A0.5). B, C, The unit discharged at an average low rate (0.70 Hz) in association with spontaneous irregular slow-wave activity on the EEG of the retrosplenial cortex (RS Cx) in the period preceding stimulation (Pre). It increased its rate markedly (to 3.10 Hz) and fired tonically during somatic stimulation in association with faster activity on the EEG. (See also supplemental Figs. 2, 3, available at www.jneurosci.org as supplemental material.) Note that the increase in unit discharge preceded the change in EEG activity (by ∼180 ms). After stimulation (Post), the unit initially decreased then ceased firing as the EEG returned to irregular slow-wave activity. Traces in B (enclosed by dashed lines) are expanded in C (arrows). The unit had a relatively long duration spike (shown in C, 0.76 and 2.55 ms at first and second zero crossings) (supplemental Fig. 2, available at www.jneurosci.org as supplemental material).