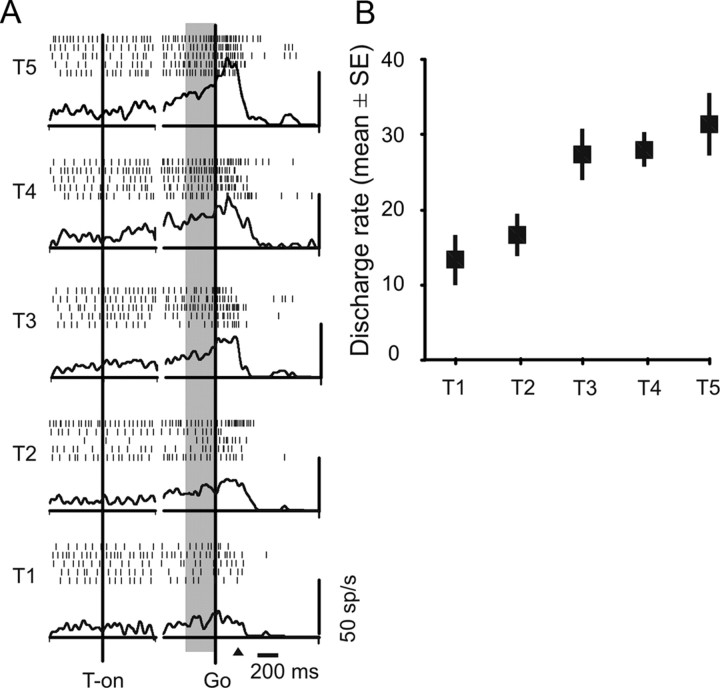
Figure 2.
Response properties of a typical reaching neuron modulated by target distance. A, Rasters and spike density functions are aligned to target presentation (T-on; left) and go-signal (Go; right). The gray area indicates the memory epoch used in B. Black arrow, Average reaction time. B, Tuning of neural activity. Mean (±SE) discharge rates for each target location (T1–T5) are shown.

