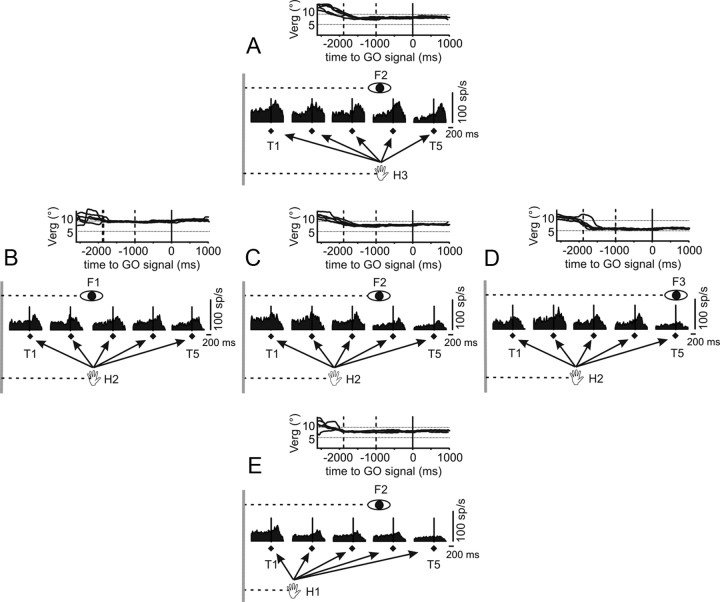
Figure 3.
Influence of hand and eye positions on the modulation of a reaching neuron tuned for target distance. Spike density functions (SDFs) of reaching activities grouped for different targets (T1–T5; black diamonds) and aligned to the go signal (black vertical line) are shown. A, C, E, Data from a fixed eye position (F2) and different hand starting position (H1–H3). B–D, Data from a fixed hand starting position (H2) and different binocular eye positions (F1–F3). Calibration bars (time and discharge rate) for SDFs are indicated for each group. Gray vertical lines represent the origin of the work space, and horizontal dotted lines represents the distance of binocular eye position and hand position from the origin. Binocular eye position is shown, as function of time, for each groups of trials. Plots are aligned to the go signal (continuous vertical line) and displayed until the end of the trial. The vertical dotted lines in the vergence (Verg) plot indicate, from left to right, the average time of fixation onset and target presentation.

