Figure 3.
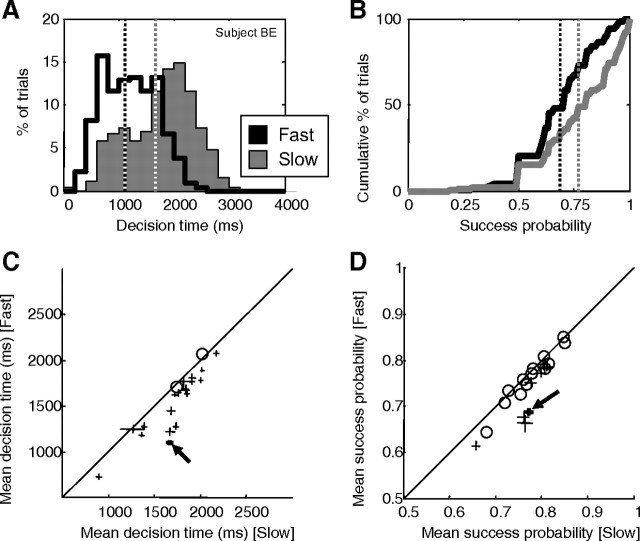
Comparison of behavior during fast versus slow blocks, using both correct and error trials. A, Distributions of the decision times of a representative subject. Dark line, Fast block (N = 319). Gray shaded region, Slow block (N = 275). The mean decision time in the fast block (dotted black line; 1105 ± 482 ms) was shorter than in the slow block (dotted gray line; 1664 ± 672 ms) (KS test, p < 10−25). B, Cumulative distribution of success probability at the time of the decision during fast (black) and slow (gray) blocks, for the same subject. The mean in the fast block (0.69 ± 0.15) was lower than in the slow block (0.77 ± 0.18) (KS test, p < 10−9). C, Average decision times of each subject during slow (x-axis) and fast (y-axis) blocks. The pluses indicate the mean and SE for subjects for whom the difference was significant (KS test, p < 0.05). The circles represent subjects for whom the difference was not significant. The arrow indicates the subject shown above. D, Average success probability at decision time of each subject during slow (x-axis) and fast (y-axis) blocks. The format is the same as in C.

