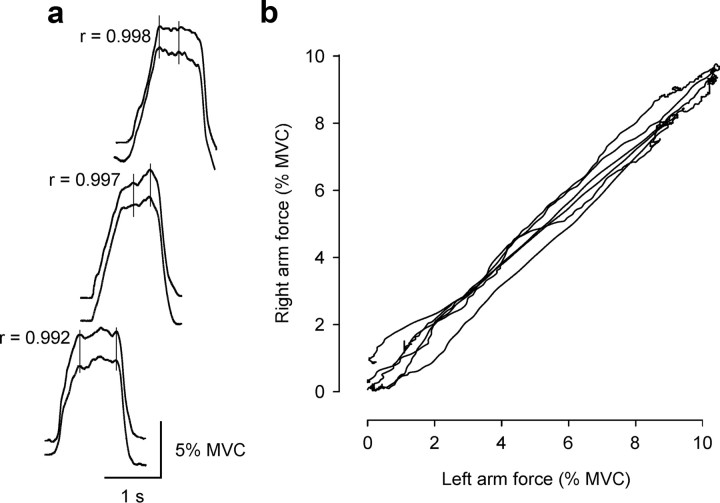
Figure 5.
Typical matching forces produced in consecutive “identical” contractions of the left and right sides in one subject before conditioning. a, Force record for the left side [10% maximal voluntary contraction (MVC)] as the top trace and for the right side as the bottom trace in each pair. Traces are offset for illustrative purposes. Pearson correlation coefficients are shown for each contraction pair. These correlations compare the absolute force produced in the left arm versus the right arm across all of the individual data points illustrated for each contraction pair. Vertical lines mark some force increments occurring bilaterally. Calibration: vertical, 5% MVC; horizontal, 1 s. b, Corresponding x–y plot of the forces produced on the two sides from the contractions shown in a.

