
Figure 4.
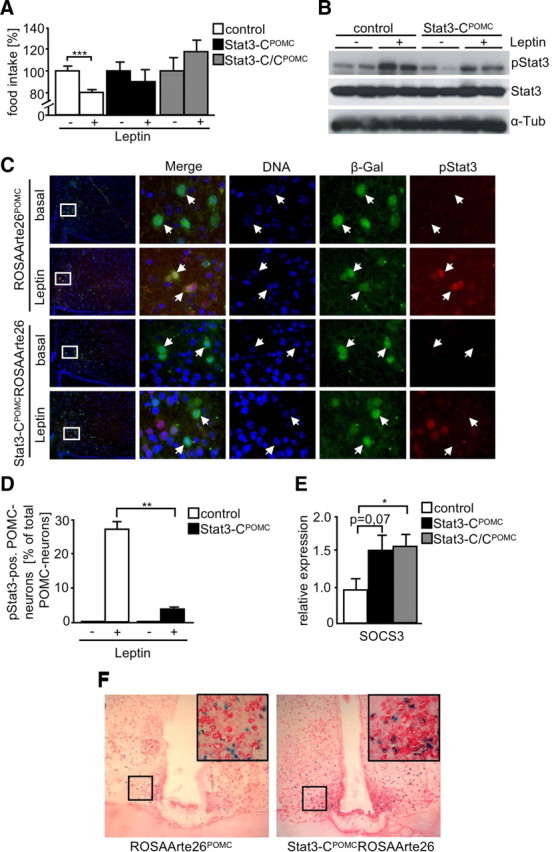
Stat3-C induces leptin resistance in POMC neurons by enforcing expression of SOCS3. A, Leptin sensitivity test of control (white bars), Stat3-CPOMC (black bars), and Stat3-C/CPOMC (gray bars) mice at the age of 17 weeks (n = 6–10/genotype). Mice were injected twice a day for three consecutive days with saline and subsequently with 2 mg/kg leptin for three consecutive days twice a day. Food intake of saline-injected control mice was set to 100%. B, Western blot analysis of ARC extracts from fasted and leptin-injected control and Stat3-CPOMC mice by use of antibodies against pStat3 and α-tubulin (α-Tub). C, Representative immunohistochemistry for pSTAT3 and β-gal in POMC neurons of fasted and leptin-injected ROSAArte26POMC and Stat3-CPOMC ROSAArte26 mice at the age of 10–12 weeks. Blue (DAPI), DNA; green, β-gal (POMC neurons); red, pStat3. D, Quantitation of pSTAT3-positive POMC neurons in hypothalamic sections of fasted and leptin-injected control (white bars) and Stat3-CPOMC ROSAArte26 (black bars) mice at the age of 10–12 weeks (n = 3–4/genotype). A total of 2103 POMC neurons were analyzed. E, Relative hypothalamic expression of SOCS3 under random-fed conditions of control (white bar), Stat3-CPOMC (black bar), and Stat3-C/CPOMC (gray bar) mice by use of quantitative real-time PCR (n = 8/genotype). F, Representative in situ hybridization using a SOCS3 probe in hypothalamic neurons of fasted ROSAArte26POMC and Stat3-CPOMC ROSAArte26 mice at the age of 12 weeks. Blue, X-gal (POMC neurons); red, SOCS3 mRNA. Displayed values are means ± SEM. *p ≤ 0.05, **p ≤ 0.01, ***p ≤ 0.001 versus control.