Figure 6.
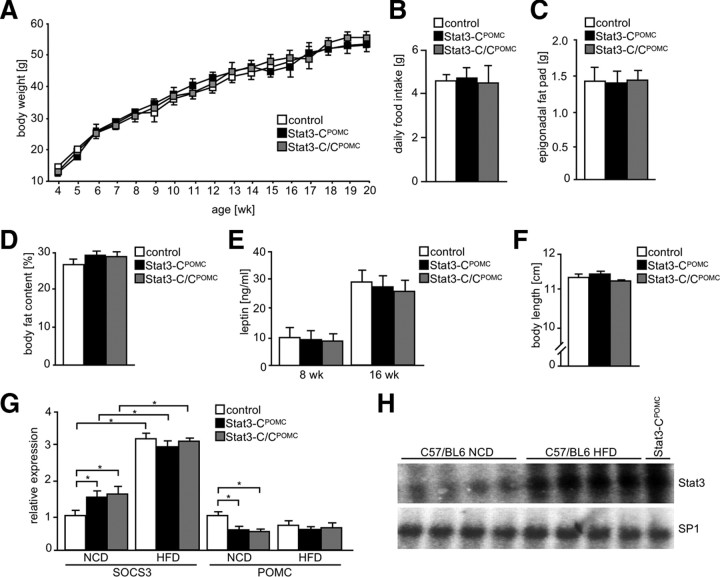
Chronic Stat3 signaling has no effect under leptin-resistant conditions. A, Body weight of control (white squares), Stat3-CPOMC (black squares), and Stat3-C/CPOMC (gray squares) mice on HFD was determined weekly (n = 8–12/genotype). B, Daily food intake of control (white bar), Stat3-CPOMC (black bar), and Stat3-C/CPOMC (gray bar) mice at the age of 10 weeks under HFD conditions (n = 8–14/genotype). C, Epigonadal fat pad weight of control (white bar), Stat3-CPOMC (black bar), and Stat3-C/CPOMC (gray bar) mice on HFD at the age of 20 weeks (n = 10–13/genotype). D, Body fat content of control (white bar), Stat3-CPOMC (black bar), and Stat3-C/CPOMC (gray bar) mice on HFD at the age of 20 weeks by nuclear magnetic resonance (n = 10–13/genotype). E, Serum leptin concentration of control (white bars), Stat3-CPOMC (black bars), and Stat3-C/CPOMC (gray bars) mice on HFD at the age of 8 and 16 weeks was determined by ELISA (n = 12–16/genotype). F, Body length of control (white bar), Stat3-CPOMC (black bar), and Stat3-C/CPOMC (gray bar) mice on HFD at the age of 20 weeks (n = 8–12/genotype). G, Relative hypothalamic expression of SOCS3 and POMC of control (white bars), Stat3-CPOMC (black bars), and Stat3-C/CPOMC (gray bars) mice under NCD (n = 12/genotype) and HFD (n = 4/genotype) conditions using quantitative real-time PCR. H, EMSA of nuclear extracts isolated from arcuate nuclei of four individual C57BL/6 mice exposed to NCD and HFD and from one Stat3-CPOMC mouse on NCD by use of radioactively labeled Stat3 and SP1 probes, respectively. Displayed values are means ± SEM. *p ≤ 0.05 versus control.

