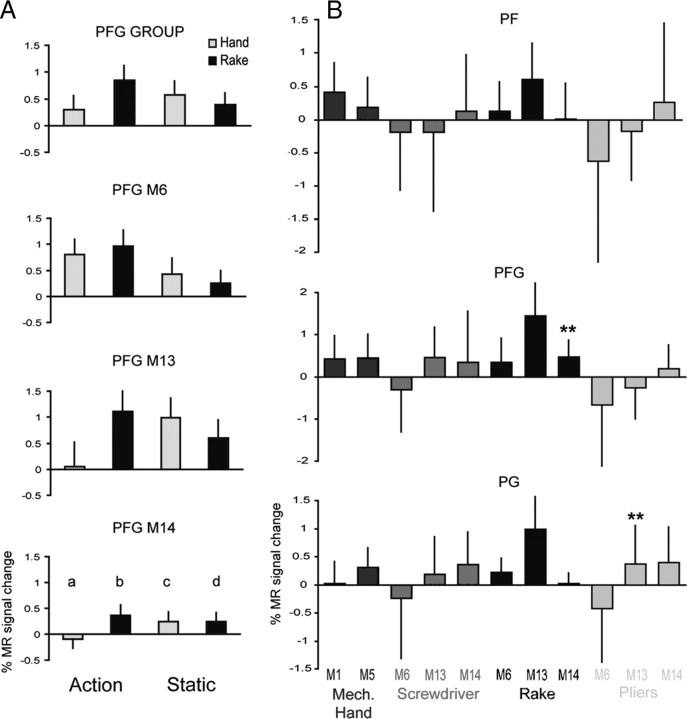
Figure 10.
ROI analysis of monkey IPL. A, Activity profiles in PFG (ROI analysis, experiment 7). B, Magnitude of the interaction (b − d − a + c) in PF, PFG and PG for different tools and monkeys. Stars indicate significant interactions. Notice that the larger percentage signal change in the monkey reflects the use of contrast agent enhanced fMRI (see Materials and Methods).

