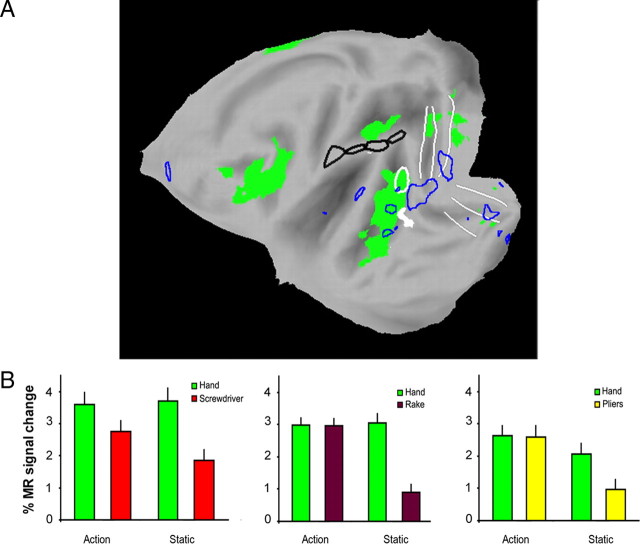
Figure 11.
Occipitotemporal interaction sites in the monkey. A, Flatmap of left hemisphere of monkey 12 (template brain) showing the regions activated (fixed effect, p < 0.001) in the contrast viewing hand action minus viewing static hand (green voxels, experiment 5) and in the interaction for the mechanical hand actions (blue outlines, experiment 5) as well as the voxels common to the interactions for the 3 tools (white voxels, experiments 6–8); ROIs as in Figure 7. B, Activity profiles of the local maximum and 6 surrounding voxels in TEO (white area in A) in experiments 6–8. Again, the larger percentage signal changes in the monkey reflect the use of contrast enhanced fMRI (Denys et al., 2004b) using the V1 activation as common reference estimated the percentage signal changes with MION to average ∼2.5-fold those obtained with BOLD at 3T. A similar factor applies here when comparing to the data of Figure 6, taking into account the larger number of human subjects from whom data are averaged.

