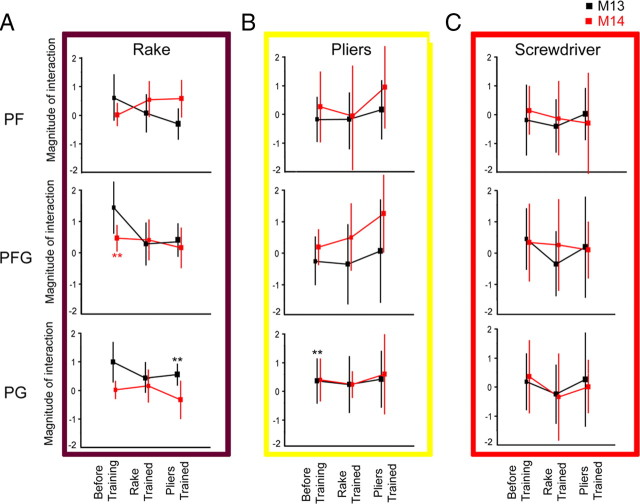
Figure 14.
ROI analysis of the magnitude of the interaction (see Fig. 10 for definition) after training. A–C, Interaction magnitude is plotted as a function of epoch for the two subjects (M13, M14) in each of the three ROIs (PF, PFG, and PG) for rake action observation (A), the pliers action observation (B) and the screwdriver action observation (C). Significant values (both paired t tests p < 0.05 corrected for multiple comparisons) are indicated by stars. Runs from A–C were tested interleaved at each epoch.

