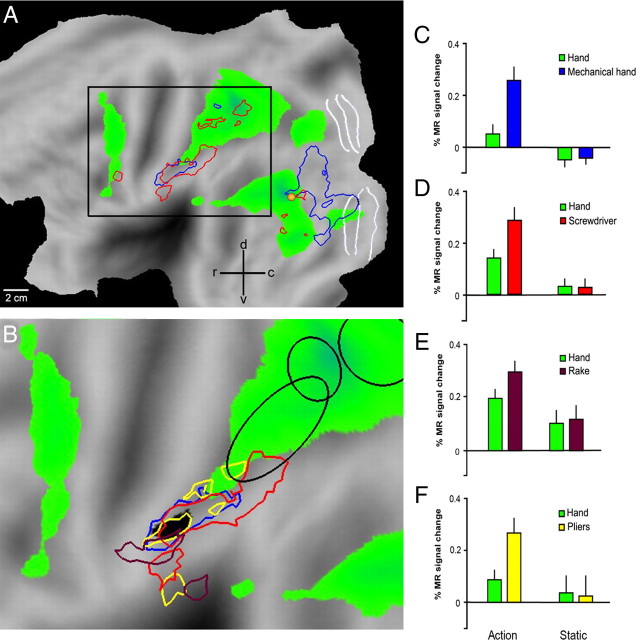
Figure 3.
The anterior supramarginal gyrus interaction site. A, Flattened view of the left hemisphere (human PALS atlas). Green areas show activations in the contrast hand action minus static control (p < 0.001, experiment 1, same data as Fig. 1A). Blue and red outlines show the regions where the interactions tool versus hand, relative to their controls, were significant (p < 0.001) in experiments 1 and 2 respectively (same data as Fig. 2A,B). White lines indicate areas V1-3, yellow dot hMT/V5+. B, Enlarged view of the data shown inside the black square in A. Only interaction sites in the vicinity of anterior SMG are shown. Brown and yellow outlines show the regions where the interactions tool actions versus hand actions, relative to their controls, were significant (p < 0.001) in experiments 3 and 4 respectively. Blue and red outlines as in A. Black voxels indicate the conjunction of the four interactions (each p < 0.005). Blue ellipses indicate from left to right putative human AIP (phAIP), the dorsal IPS anterior (DIPSA) region and the dorsal IPS medial (DIPSM) region. C–F, Activity profiles of the core of the left aSMG region (black voxels in B) in experiments 1–4. All eight paired t tests were significant (see Materials and Methods): p < 0.0001 for both tests in C (interaction and direct comparison of actions), p < 0.001 for both tests in D, p < 0.01 for both tests in E and p < 0.05 for both tests in F.

