
Figure 7.
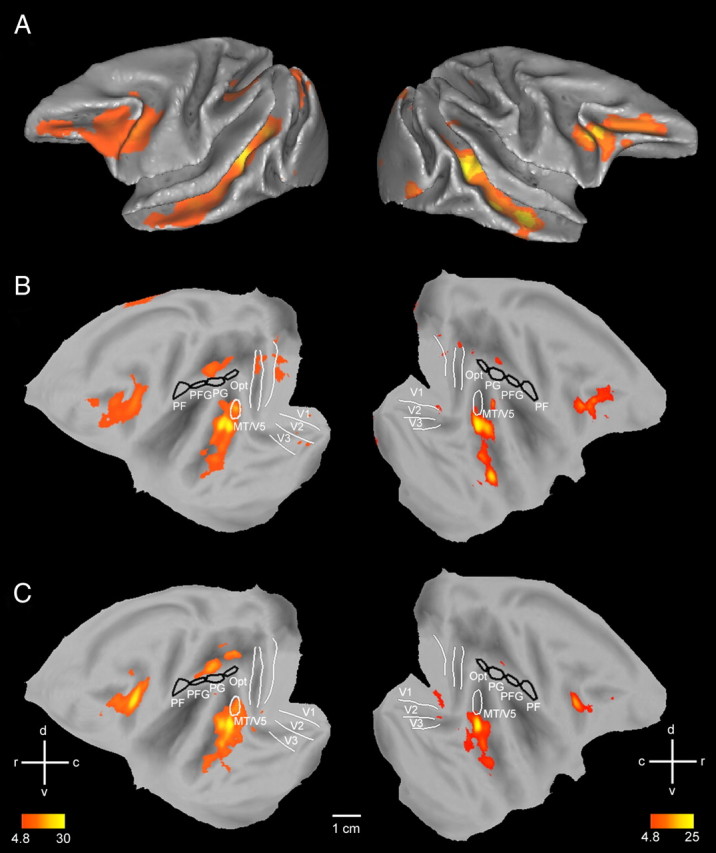
Results of experiment 5. A–C, Folded left and right hemispheres (A) and flatmaps (B, C) of left and right hemisphere of monkey template (M12) brain (Caret software) showing cortical regions activated (n = 2, fixed effects, p < 0.05 corrected, experiment 5) in the subtraction observation of hand action minus static hand (A, B) and observation of mechanical hand action minus static mechanical hand (C). Both subtractions were masked inclusively with the contrast action observation minus fixation. Black outlines, PF, PFG, PG and Opt; outlines of visual regions (V1-3, MT/V5) are also indicated. Color bars indicate T-scores. See also supplemental Figure S1, available at www.jneurosci.org as supplemental material.