
Figure 3.
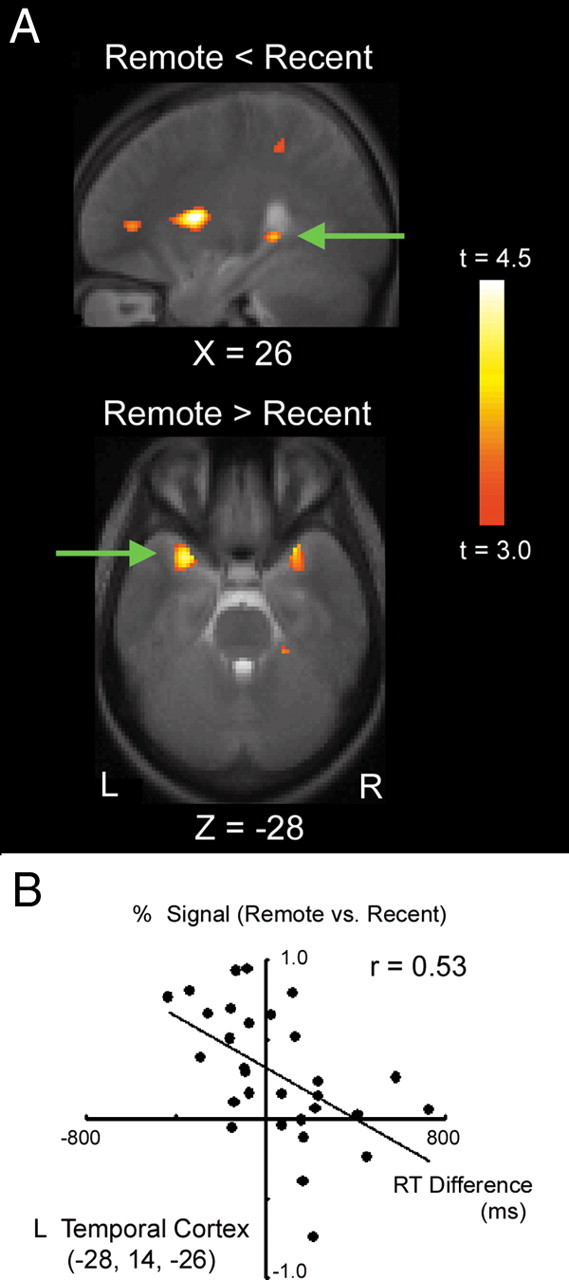
A, Statistical activation map for the contrast of recent versus remote trials (top) and remote versus recent trials (bottom). The activation map is displayed as a sagittal or transverse section and is overlaid on top of the anatomic image averaged across subjects. Significant activations in the right hippocampal region (top) and the left anterior temporal region (bottom) are indicated by green arrows. Statistical significance is indicated using the color scale to the right, and the section level is indicated using the X or Z coordinate of the Talairach space. B, Scatter plots of the anterior temporal activation against reaction time difference between remote trials in the test session and all the trials in the mid-session retention test (see Materials and Methods). One plot indicates data from one subject. L, Left; R, right.