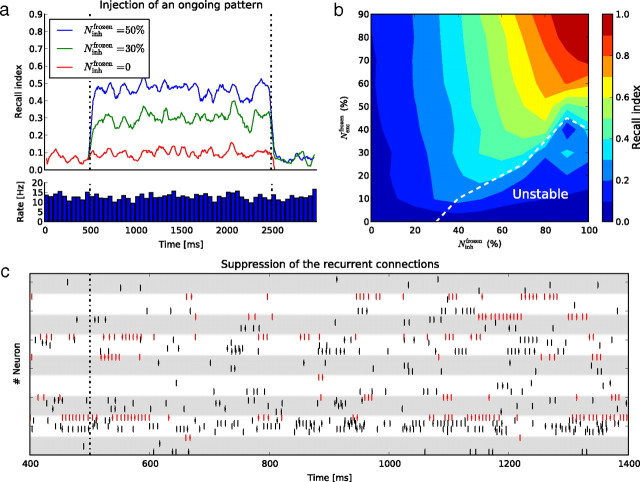
Figure 3.
a, Kinetics of the recall index (the normalized cross-correlation between the target activity and the response) as a function of time, before, during, and after the frozen stimulation. b, Steady-state recall index color coded, as a function of the proportion of excitatory and inhibitory neurons that are frozen. The white dotted line delineates a zone of instability of the network in which the AI regime is not sustained. c, Raster plot of responses, as in Figure 1b, when recurrent connections between free-running neurons are cut and replaced by independent Poisson spike trains producing an equivalent mean level of input to the cells.

