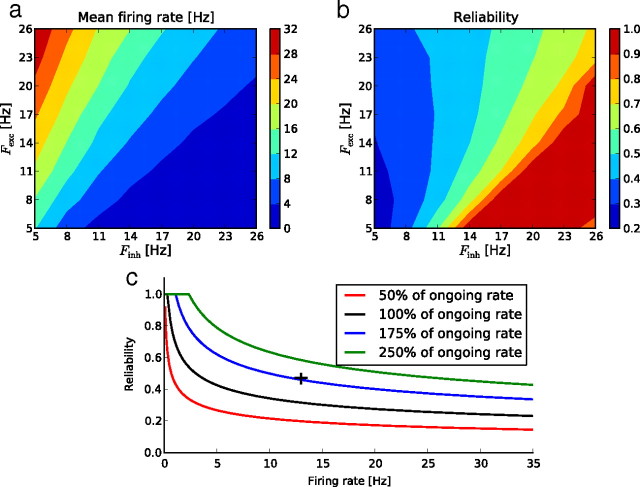
Figure 5.
a, b, Mean firing rate (a) and reliability (b), color coded, in response to global Poisson stimulation, for different excitatory and inhibitory firing rates. c, Reliability versus mean firing rate for different total spike counts. Each “iso-spike count” curve corresponds to the stimulations of a and b with the same total number of spikes as in the Poisson stimulation, but differently partitioned between excitatory and inhibitory populations. The black cross indicates the reliability and mean firing rate for the spontaneous pattern.

