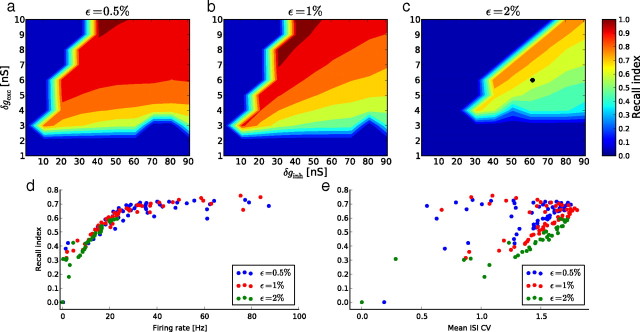
Figure 7.
a–c, Recall index for 50% of neurons frozen as a function of the excitatory and inhibitory synaptic weights, and for different connection probabilities ϵ: 0.5% (a), 1% (b), and 2% (c). The dark blue zones indicates regions in which the network either cannot sustain spontaneous activity or enters a synchronous regular state. d, e, Recall index values obtained in a–c plotted against the mean firing rate (d) and ISI CV (e) of the spontaneous activity of the same network.

