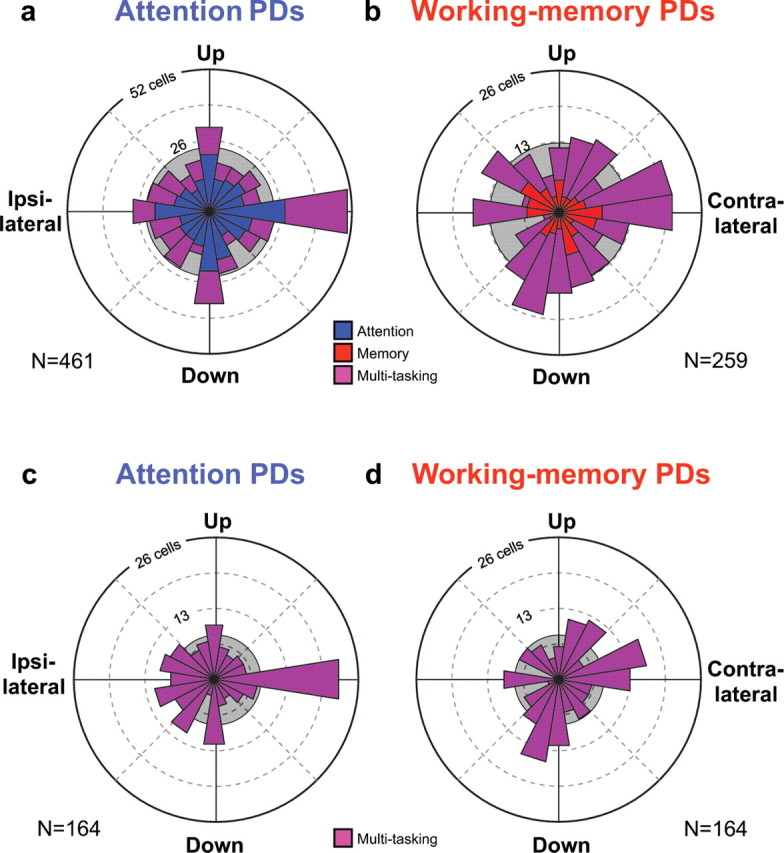
Figure 3.

Spatial distribution of attention and working-memory PDs. a, The radius of the circular histogram shows the number of neurons with attention PDs in each 18° bin. The population includes 297 attention neurons (blue) and 164 multitasking neurons (purple). b, Distribution of working-memory PDs, plotted at one-half the scale of distribution (a). This population includes 95 working-memory neurons (red) and the 164 multitasking neurons (purple). Distribution of attention PDs (c) and working-memory PDs (d) for multitasking cells only. The PD distributions all differed significantly from a uniform distribution (shaded circles), and both attention PD distributions (a, c) exhibited a significant bias toward the cardinal directions.
