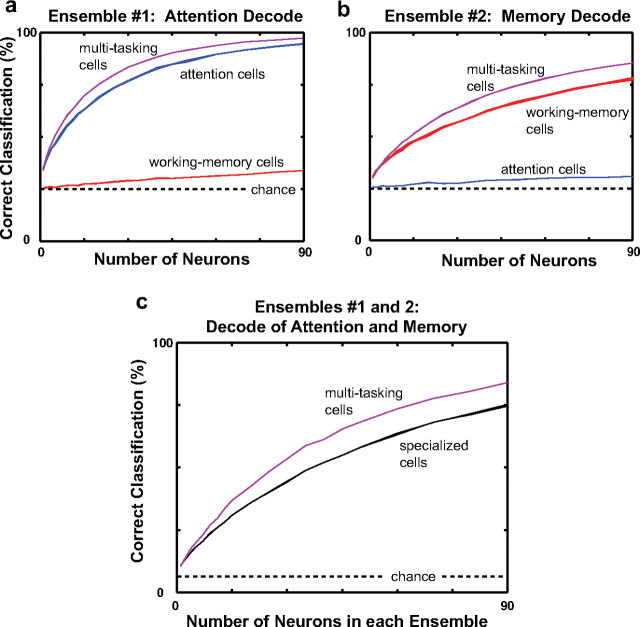
Figure 9.
Neuron-dropping curves for multitasking versus specialized neurons. The curves show the percentage of single trials correctly classified as a function of the number of neurons used in the computation (see Materials and Methods). The width of each curve shows ±1 SD around the average percentage of correct classifications. Groups of multitasking neurons (purple curves) were more efficient at encoding the attended (a) and remembered (b) location than equal-size groups of either attention neurons (blue curves) or working-memory neurons (red curves). In c, the black curve shows the performance of the specialized cells at decoding both the attended and remembered locations. This population was constructed from an ensemble of attention cells that was used to classify the attended location and an ensemble of working-memory neurons that was used to classify the remembered location. The classification was considered correct when both ensembles were correct. The purple curve shows the performance of two random ensembles of multitasking neurons, one for decoding the attended location and one for the remembered location. Decoding both locations was, as in a and b, more efficient using multitasking cells than the combination of the two specialized cell types, with each decoding only its specialty. The dashed horizontal line shows chance levels of decoding.

