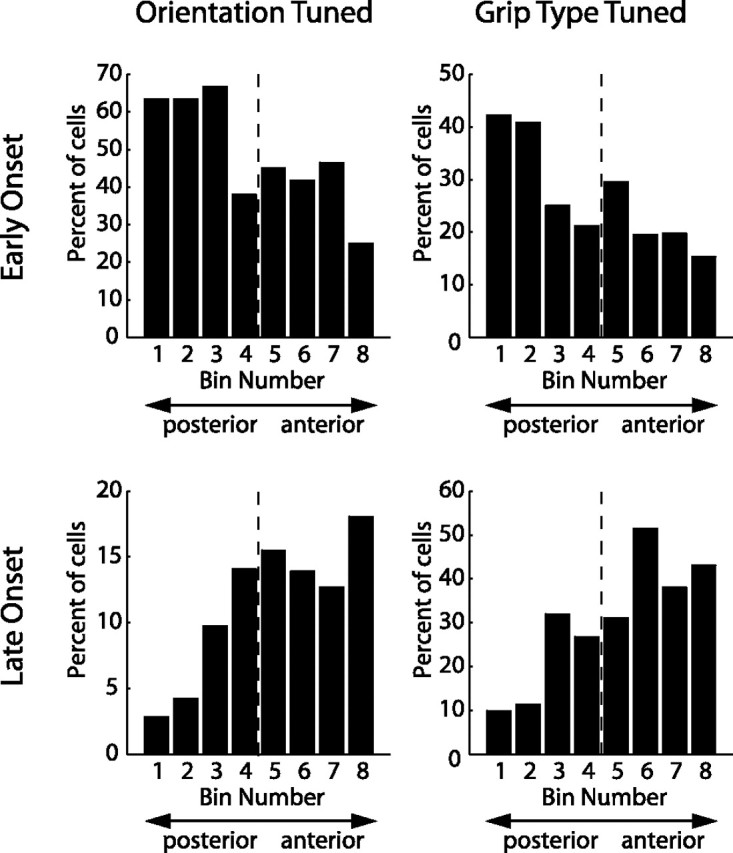
Figure 10.

Anatomical distribution of different cell classes. Cells (N = 571) were distributed into eight bins according to their location along the intraparietal sulcus, such that each bin contained the same number of cells. Bin 1 contained the most posterior and bin 8 the most anterior cells (x-axis). Individual panels show the distribution along the intraparietal sulcus (IPS) for a particular cell class (left: orientation tuned, right: grip type tuned, top: early onset, bottom: late onset). Histograms display the fraction of cells in each bin that belonged to the respective cell class. Early onset cells showed a decreasing, late onset cells an increasing gradient from posterior to anterior. Dashed line, Median of the population.
