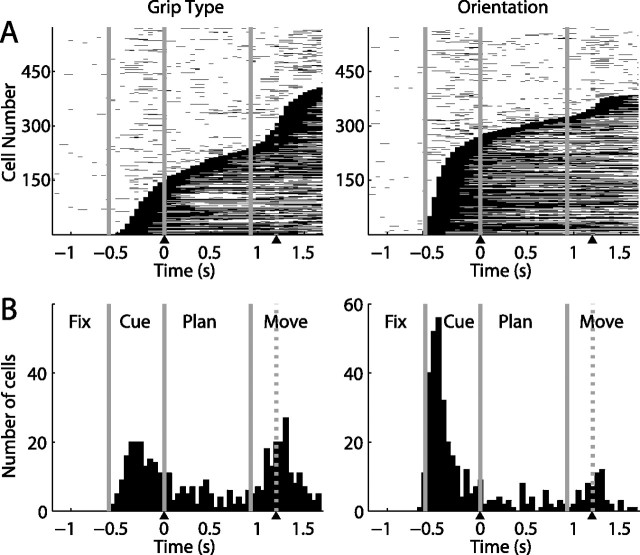
Figure 4.
Times with significant tuning in the neuronal population. A, Sliding window analysis (two-way ANOVA) for each cell (y-axis) at each time step (x-axis). Significant grip type (left) and orientation tuning (right) is indicated by black squares (p < 0.01). Cells are ordered by tuning onset (first occurrence of five consecutive significant steps). B, Histogram of tuning onset for grip type (left) and orientation (right) across the population.

