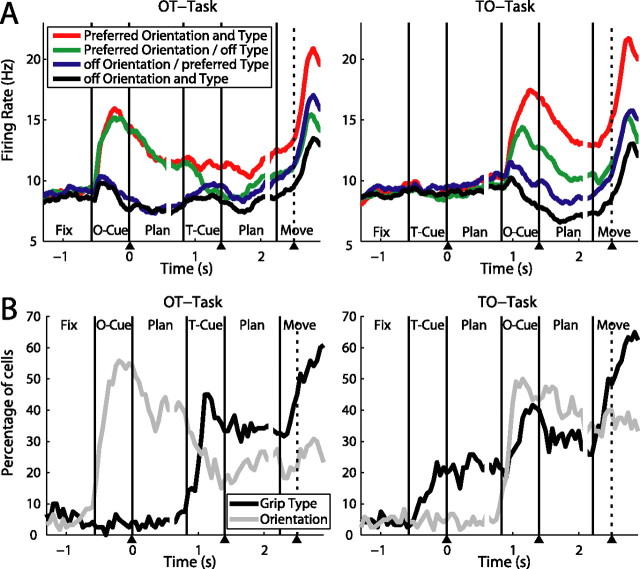
Figure 6.
Population analysis of the cue separation task. A, Population firing rates in the cue separation task (N = 120) with OT task on the left and TO task on the right panel. For each cell, its preferred type and orientation was established in the delayed grasping task (data not shown). B, Fraction of cells that were significantly tuned by grip type and orientation in the course of the OT and TO task (sliding window ANOVA as in Fig. 3B).

