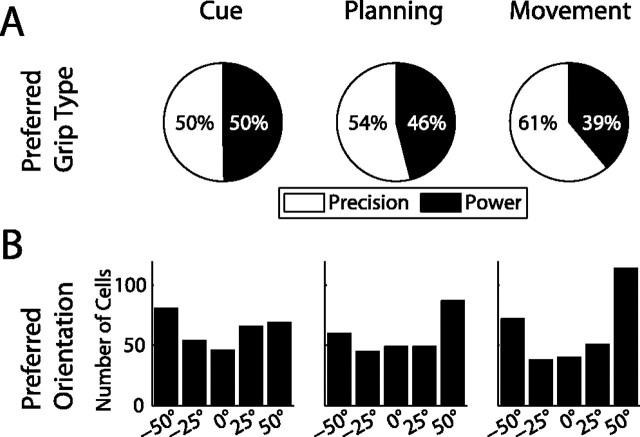
Figure 7.
Distribution of preferred grip type and orientation in various task epochs. A, Ratio of cells preferring precision (white) or power grip (black). From cue to movement, the fraction of cells encoding precision grip increased substantially. B, Number of cells preferring each of the five orientations. In the movement epoch, the distribution shifts in favor of terminal orientations (±50°).

