Figure 8.
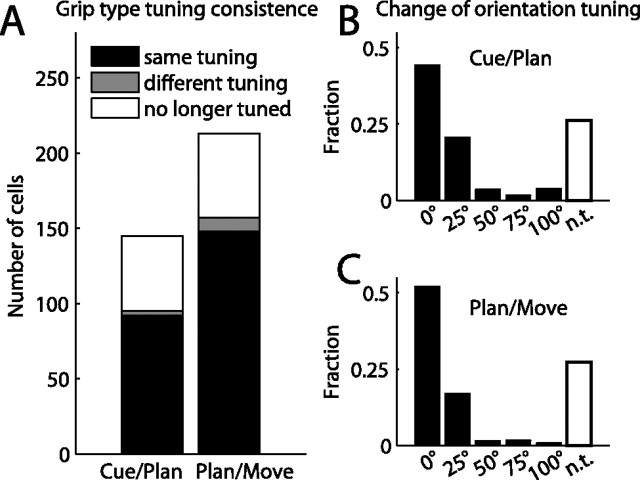
Tuning consistency across task epochs. A, Grip type tuning. Histogram bars indicate the number of cells that stay tuned for the same grip (black), change preference to the opposite grip (gray), or lose their tuning (white) when transitioning between consecutive task epochs (cue–planning and planning–movement). B, C, Change of orientation tuning in consecutive task epochs: cue–planning (B) and planning–movement (C). Histograms show the fraction of cells for which the preferred orientations in the two epochs were the same (0° shift), neighboring orientations (25°), or further apart (50–100°), and of cells that lost their tuning (white bars). Preferred orientation shifts of >25° were rare. In general, cells were tuned consistently over time.

