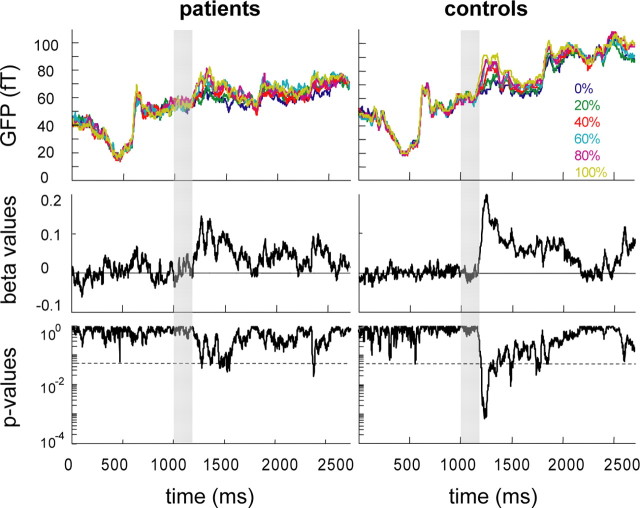
Figure 3.
Dependency of the GFP on visual motion coherence. Diagrams on the left and right depict results of the patient and control group, respectively. RMS values averaged over the subjects are plotted for the six coherence levels (indicated by different colors: blue = 0%, green = 20%, red = 40%, cyan = 60%, magenta = 80%, yellow = 100%) as function of time. The lower panels show the corresponding β and p values, respectively, obtained from a linear regression between RMS values and motion coherence for each sample point. The broken horizontal line in the two lower plots marks a p value of 0.05. Time of the test stimulus presentation is indicated by a gray bar.

