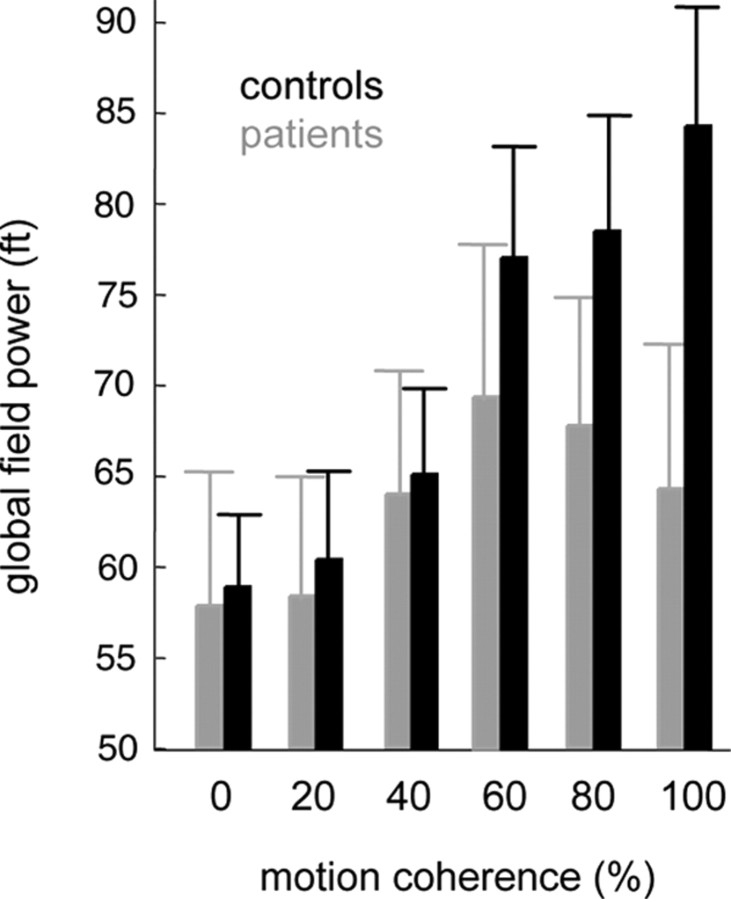
Figure 4.
Global field power as function of motion coherence shown for the group of patients (gray bars, means ± SEM) and controls (black bars, means ± SEM). Six samples around the time point for which regression analysis had started to reveal a significant (p < 0.05) linear correlation between GFP and motion coherence were averaged for each coherence level and for the two groups, separately (controls: 230 ms, patients: 280 ms after test stimulus onset, compare Fig. 3). Responses obtained for 80 and 100% motion coherence were significantly lower in the patient group as compared to controls (p < 0.05, t test, corrected for multiple comparisons).

