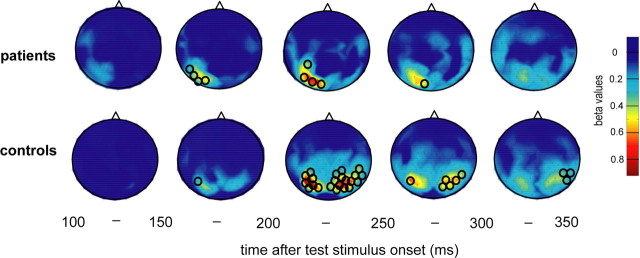
Figure 6.
Mapping of dependencies of MEG responses on motion coherence projected onto two-dimensional MEG sensor maps (seen from above, nose up). Spatial distribution of β values derived from group analysis (linear regression of magnetic field size over coherence levels) performed for each sensor separately. Results are plotted for the group of patients (upper plots) and controls (lower plots) in time bins of 50 ms starting with a first period covering 100–150 ms after test stimulus onset. Maps are color coded with bluish colors signifying low β values, i.e., low or missing dependencies of MEG responses on motion coherence, and warm colors indicating high β values. Significant sensors (p < 0.05) are marked with a black circle.

