
Figure 4.
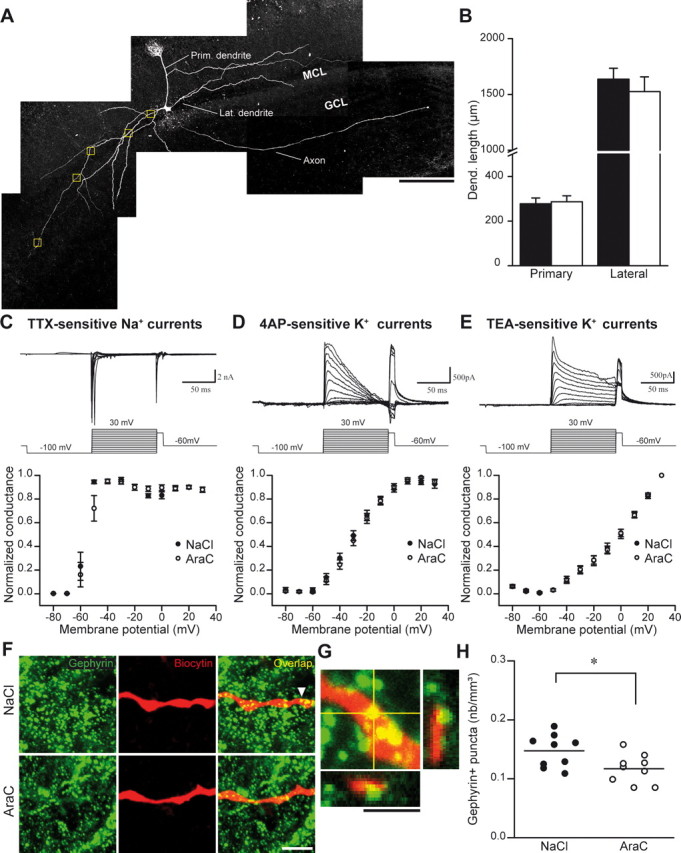
Reduced number of GABAergic postsynaptic sites on the mitral cells lateral dendrite after the suppression of neurogenesis. A, Reconstitution of confocal images of the mitral cells filled with biocytin. MCL, Mitral cell layer; GCL, granule cell layer. The boxed regions show an example of sampling used for the quantification shown in H. B, Morphological analysis of the mitral cells demonstrating no significant difference in the primary and lateral dendrite lengths when neurogenesis is stopped. Data are presented as mean ± SEM (n = 10 and 9 cells for control and AraC-treated animals, respectively). C–E, Membrane properties of mitral cells in control (NaCl) and AraC-treated animals. Top, Individual experiments illustrating TTX-sensitive Na+ currents and TEA- and 4AP-sensitive K+ currents recorded in mitral cells. Calibration: C, 2 nA, 50 ms; D, E, 500 pA, 50 ms. Bottom, Plot of the membrane potential as a function of the normalized conductance for the different currents recorded from the mitral cells in the saline- and AraC-treated animals. Note that there were no significant differences between different voltage-dependent currents. Data are presented as mean ± SEM (n = 10 cells in NaCl and 11 cells in AraC treatment for Na+ currents; n = 7 in both treatments for K+ currents). F, Confocal images of biocytin-labeled dendrite in NaCl- and AraC-treated OB stained for the postsynaptic GABAergic marker gephyrin. Scale bar, 5 μm. G, Enlarged orthogonal view of the gephyrin puncta indicated by an arrow in F. Scale bar, 2 μm. H, Gephyrin+ punctum density quantification on the mitral cell lateral dendrites for the NaCl- and AraC-treated mice (n = 9 cells for control and AraC-treated animals). Each dot represents the value for one single cell. Horizontal bars represent the mean value for all mitral cells for each condition. *p < 0.05; Student's t test.