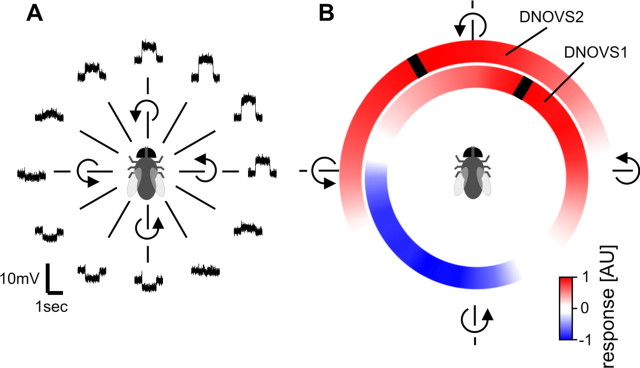
Figure 2.
Preferred axis of rotation of DNOVS1 and DNOVS2. A, Example responses of DNOVS1 to 12 different axes of rotation. B, Mean responses to 36 axes of rotation of DNOVS1 (n = 4 flies) and DNOVS2 (n = 3 flies), shown in color code. Red represents a depolarization of DNOVS1 or an increase of the firing rate of DNOVS2, blue a hyperpolarization. Black bar indicates the preferred axis of rotation.

