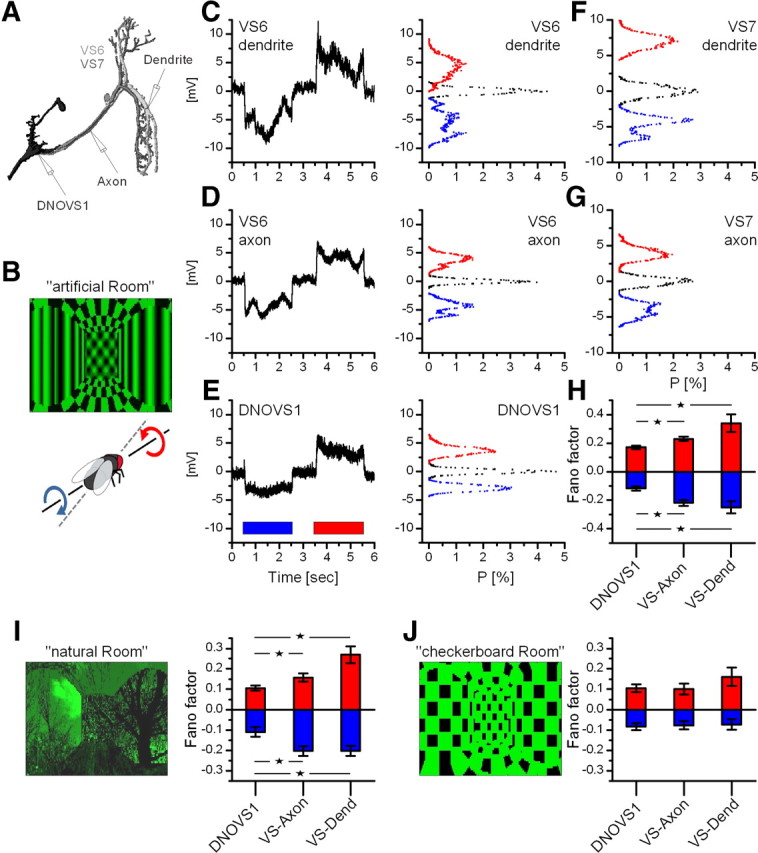
Figure 4.

Robust coding of the axis of rotation in DNOVS1. A, Schematic drawing of the intracellular recording sites. VS6 and VS7 were recorded in the dendrite as well as in the axon, DNOVS1 in the dendrite. B, Picture of the stimulus movie called “artificial room” (movie can be seen in the supplemental material, available at www.jneurosci.org) representing a rotation around an axis at 30° azimuth. C–E, Average responses and membrane potential distributions of a VS6 dendrite, a VS6 axon, and a DNOVS1 cell to clockwise (blue) and counterclockwise rotation (red). Black distributions represent the variation of the resting membrane potential. F, G, Example membrane potential distributions of a VS7 dendrite and a VS7 axon. H, Mean Fano factors of DNOVS1, VS axon, and VS dendrite (pooled data from VS6 and VS7) for clockwise (blue) and counterclockwise (red) rotation. The mean values for DNOVS1 and VS axon/VS dendrite differed significantly. Data are from n = 7 DNOVS1, n = 7 VS axon (4 VS6, 3 VS7), and n = 12 VS dendrite (8 VS6, 4 VS7). I, Picture of the stimulus movie “natural room.” The Fano factors of DNOVS1 and VS axon/dendrite to rotations of the natural room differed significantly. Data are from n = 8 DNOVS1, n = 5 VS axon (2 VS6, 3 VS7), and n = 9 VS dendrite (5 VS6, 4 VS7). J, Stimulation with the “checkerboard room” elicited no observable difference in the responses of DNOVS1 and VS axon/dendrite. Data are from n = 5 DNOVS1, n = 3 VS axon (2 VS6, 1 VS7), and n = 8 VS dendrite (5 VS6, 3 VS7). Statistical tests were done between DNOVS1, VS axon, and VS dendrite (*p < 0.05, Wilcoxon rank sum test).
