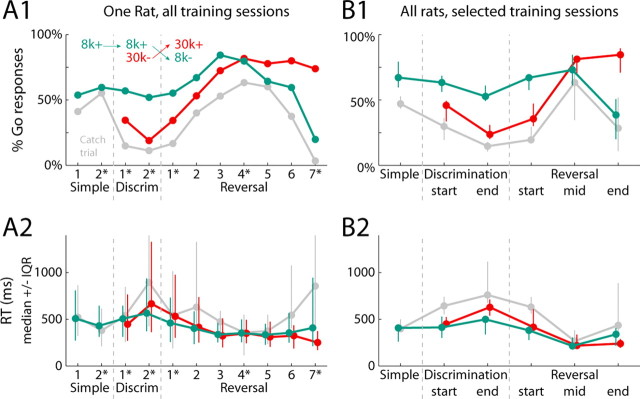
Figure 2.
Behavior measures of discrimination and reversal learning. A, Behavioral data for a single rat across all training sessions. A1, The likelihood of a Go response after each stimulus is shown across training (green = 8 kHz tone; red = 30 kHz tone; gray = no stimulus/catch trial). The inset depicts the reward contingencies in effect at each stage of training. The dashed gray lines mark transitions between training stages (simple RT task, discrimination learning, and reversal). A2, Reaction time data for each trial type are shown across training (median ± IQR). B, Behavioral data are shown from all rats at each stage of training (the first session of reversal training, a session in the middle of reversal training in which rats responded at similar rates to the two stimuli without an RT difference, and a session in which rats achieved criteria performance on the reversed discrimination). It was necessary to select sessions for analysis in this study due to rats requiring different numbers of training sessions to progress through the entire training process. Starred numbers in A indicate the sessions selected for analysis for that particular subject. Conventions for Go responses (B1) and RT data (B2) are as in A.

