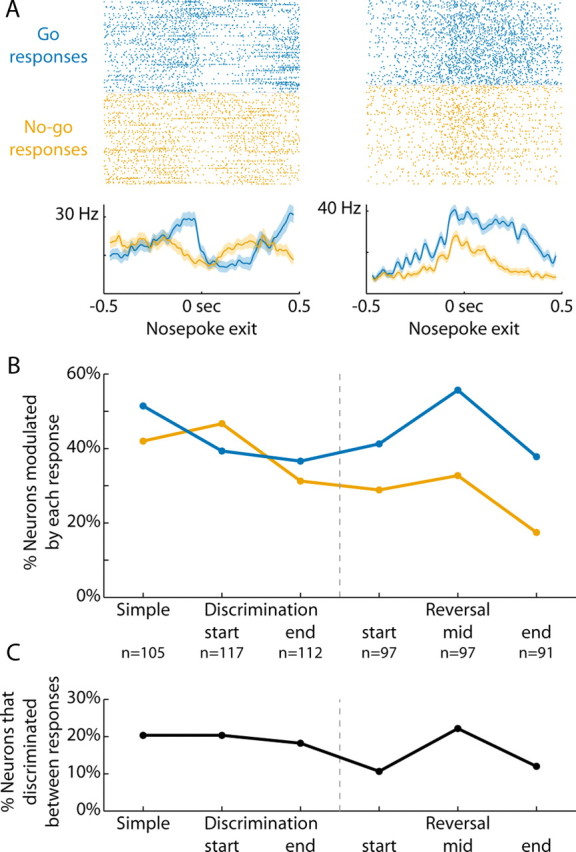
Figure 6.

Delay period activity reflected action selection. A, Rasters and peri-event time histograms are presented from two neurons that discriminated between Go and No-go responses (Go = blue, No-go = orange; −200 ms window before nosepoke exit, ranksum p < 0.05). B, The percentage of neurons modulated on trials of each response type (±200 ms, signrank p < 0.05) are plotted across the various stages of training. Across subjects, ANOVA revealed significant main effects of training (discrimination learning: F(2,33) = 5.8, p < 0.01; reversal learning: F(2,33) = 5.0, p < 0.02). There was a significant effect of response type (Go or No-go) during reversal learning (F(1,33) = 14.0, p < 0.001), but not during discrimination learning (F(1,33) = 1.0, p > 0.3). C, The percentage of neurons that discriminated between the two responses (−200 ms window before nosepoke exit, ranksum p < 0.05) are plotted throughout discrimination and reversal training. The percentage of neurons whose activity was different showed a statistical trend to change with training (ANOVA, discrimination learning: F(2,9) = 0.1, p > 0.8; reversal learning: F(2,10) = 1.7, p > 0.2).
