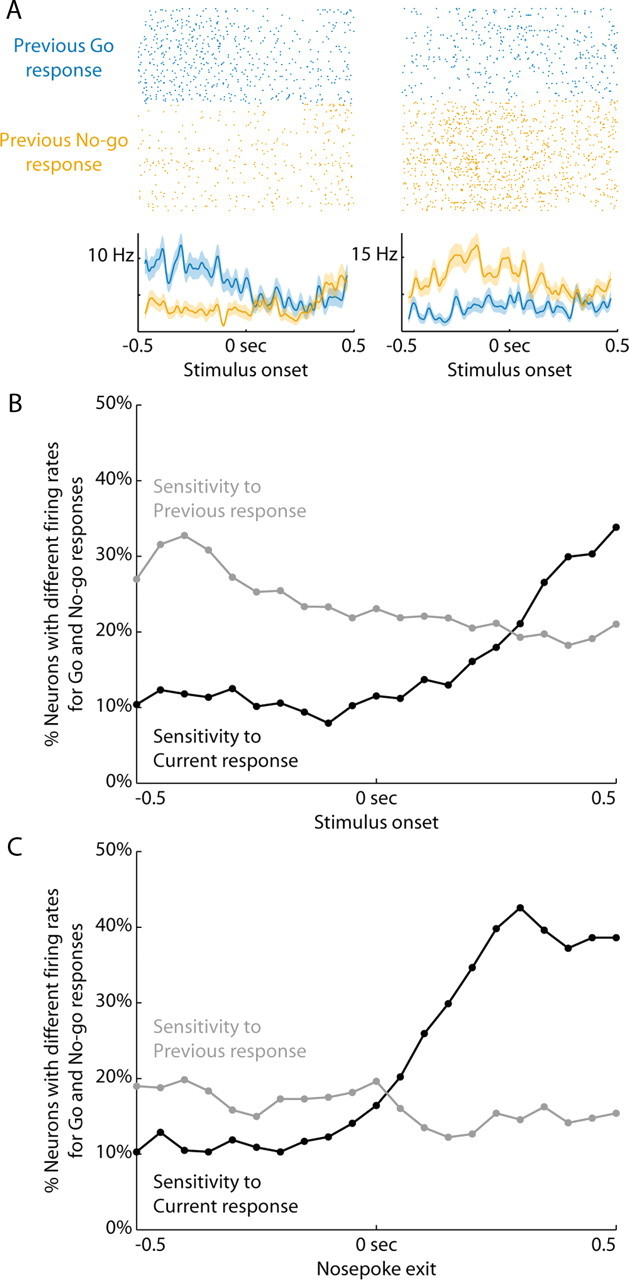
Figure 7.

Neural firing rates were sensitive to the previous response. A, Rasters and peri-event time histograms are presented from two neurons sensitive to the previous response (200 ms window at the end of the delay period of the next trial before stimulus onset, ranksum p < 0.05). Trials after a Go response are blue and trials after a No-go response are orange. The neuron on the left fired more after a Go response and the neuron on the right fired more after a No-go response. In the final 200 ms of the delay period, just before a stimulus was delivered, 21% of neurons were sensitive to the previous response (101/474 neurons across training). B, The percentage of neurons sensitive to the previous response (gray) or current response (black) are plotted relative to the onset of the stimulus. A 200 ms sliding window was moved from −0.5 s before the stimulus until 0.5 s after, in 50 ms steps. Data are plotted at the time point signifying the end of the window, i.e., the point at 0 s includes neural activity from the 200 ms before the stimulus. The firing rates in these windows were compared for Go and No-go responses (ranksum, p < 0.05). The percentage of neurons that were sensitive to the previous response decreased as time progressed into the next trial. C, Sensitivity to the previous and current responses are plotted with neural activity aligned to nosepoke exit. Conventions are as in B. Neurons reflected the current response primarily after the animal was already moving.
