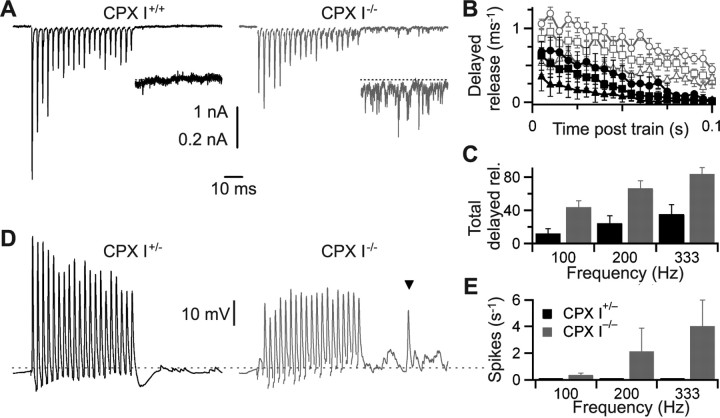
Figure 7.
Delayed release is enhanced in CPX I−/− endbulbs. A, Example voltage-clamp traces in CPX I+/+ and CPX I−/− bushy cells, showing increased delayed release after 333 Hz stimulation. The insets are magnified fivefold for the time period after the train. The horizontal calibration applies to all traces in A and D. B, Average time course of delayed release in the first 100 ms after the end of 20 pulse, high-frequency trains. The symbols are as in Figure 6, D and G. Data are averages of eight (CPX I+/+) or nine (CPX I−/−) experiments. C, Total delayed release integrated over the first 100 ms after a train. Delayed release increases with stimulation frequency. Delayed release in CPX I−/− endbulbs is significantly greater than in CPX I+/+ for all frequencies (p < 0.01). D, Example current-clamp traces in CPX I+/− and CPX I−/− bushy cells showing increased delayed release, as well as misplaced spikes (inverted triangle). The dashed line corresponds to a membrane voltage of −60 mV. E, Average number of misplaced spikes, measured over the first 40 ms after the train. No misplaced spikes were detected in any CPX I+/− endbulbs (n = 7 cells), and CPX I−/− endbulbs showed considerable variability (n = 11 cells). Misplaced spikes were significantly elevated for 100 and 333 Hz cases (p < 0.05). Error bars indicate SEM.

