
Figure 4.
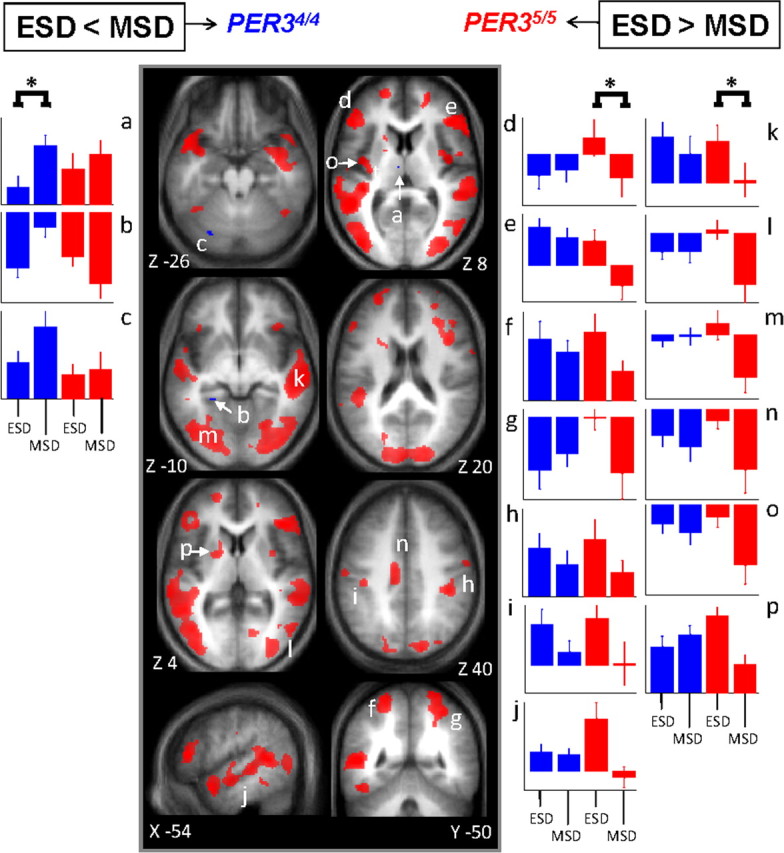
Significant differences in brain response between the sessions recorded after 25 and 14 h of wakefulness. Middle panels, In PER34/4 (blue), only significant increased activations were found in MSD compared with ESD. In PER35/5 (red), only significant reduced activations were found in MSD compared with ESD (see Table 3 for the names corresponding to the letters in the structural image). Lateral panels, Mean activity estimates (a.u. ± SEM) at ESD and MSD. Left (a–c) ESD < MSD; right (d–p) ESD > MSD. Note that in left panels, for all areas indicated by an asterisk (*), there were significant increases in activation, i.e., only in PER34/4, whereas in right panels, for all areas indicated by an asterisk (*), there were significant decreases in activation, i.e., only in PER35/5.