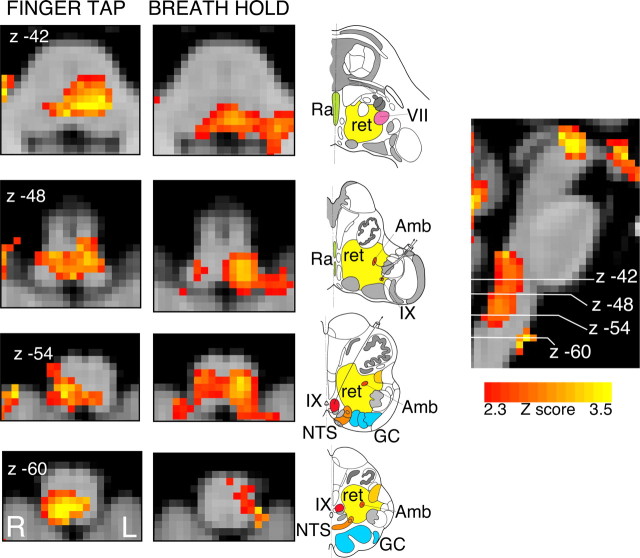
Figure 5.
BOLD response in the brainstem to finger tapping and to breath hold, in 11 subjects (no-drug infusion) having accounted for CO2-induced vasodilatation. The images consist of a color-rendered statistical map superimposed on a standard (MNI) brain. Significant regions are displayed with a threshold of Z > 2.3, with a cluster probability threshold of p < 0.05 (corrected for multiple comparisons). The sagittal image on the right displays the position of slices, but for clarity only displays the activation map for the breath hold contrast. Abbreviations: R, Raphe nuclei (serotoninergic); ret, nuclei reticularis including adrenergic and noradrenergic centers; VII, facial nucleus; Amb, nucleus ambiguus; IX, glossopharyngeal nucleus; NTS, nucleus tractus solitarius; GC, gracile (medial) and cuneate (lateral) nuclei (in blue). Line drawing is adapted from Duvernoy (1995) showing approximate position of nuclei. R (right) and L (left) indicate image orientation.

