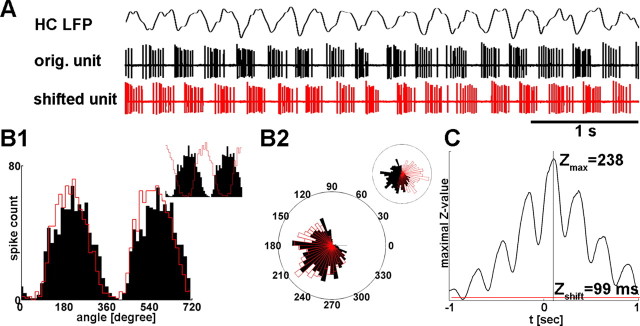
Figure 1.
Z-shift methods. A, Z-shift analysis of the longest theta segment of a registration is demonstrated. A 5-s-long epoch from the hippocampal LFP bandpass filtered between 2 and 8 Hz is shown above medial septal unit activity. Red action potential series correspond to the MS unit delayed by Z-shift, the optimal time lag with which shifting unit activity results in the strongest phase locking (see Materials and Methods). B1, Circular distribution of phase values of septal action potentials relative to hippocampal theta oscillation is displayed in black for two theta cycles (zero phase was associated to the trough of the theta cycle). The red line indicates phase angle distribution of the shifted septal action potentials, centered to overlap with the original distribution. (The relationship of the two histograms without centering is shown on the inset.) Histogram of shifted unit is slightly more focused than the original, which means higher level of phase preference. Rayleigh's Z-statistic is sensitive enough to measure such mild differences reliably. B2, The same phase histograms are shown on rose diagram; inset displays rose diagram without centering the histogram of shifted action potentials. C, Rayleigh's Z-statistic is plotted against different time lags from −1 to 1 s. The red line shows the level of significant phase locking at p = 0.005. Maximum location of the function is Z-shift, the optimal delay to reach the highest “synchrony” between LFP and septal unit, whereas maximal Z value describes the strength of the maximal coupling.

