Figure 2.
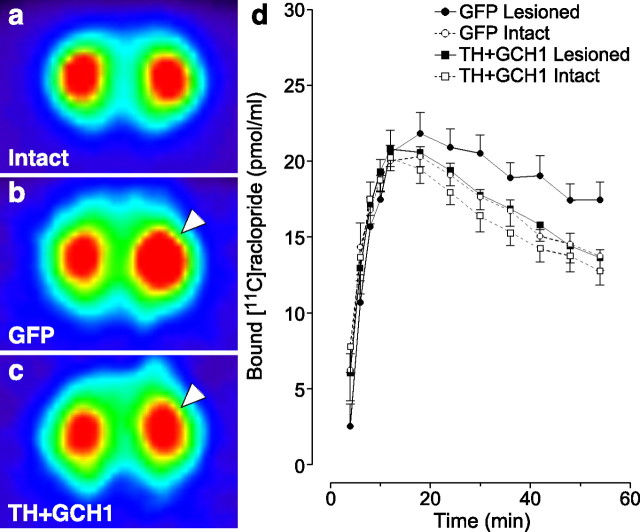
[11C]raclopride PET experiments. The FORE-OSEM algorithm reconstructed tomographic data are illustrated as pseudocolored images indicating radioactivity levels high to low (from red–yellow to green–blue), in an intact rat (a), in a lesioned rAAV5–GFP-injected control rat (b), and in a lesioned rat treated with the TH + GCH1 therapeutic genes (c). Note the large increase on the [11C]raclopride signal on the lesion side (right hemisphere as indicated with arrowhead) in b and the normalization of the binding in the treated animal (arrowhead) in c. The kinetics of specific [11C]raclopride binding is plotted against time to illustrate the increased signal on the lesion side of the rAAV5–GFP-injected control animals starting at 24 min and maintained for the rest of the scanning period, whereas in the rAAV5–TH + rAAV5–GCH1-treated rats, similar levels of binding were seen between the two sides (d).

