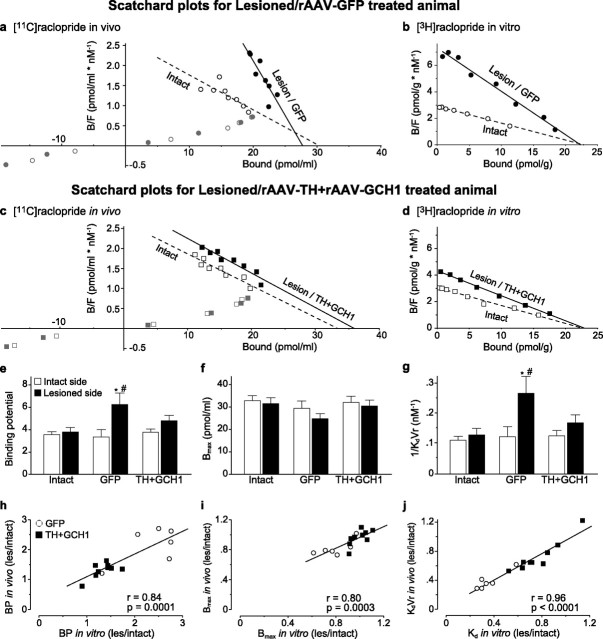
Figure 3.
Quantification of the [11C]raclopride PET data. Analysis of the raclopride striatal binding was conducted by plotting the binding data in Scatchard plots both in vivo (a, c) and in vitro (b, d). The data points from the lesion/GFP side clearly deviated from those on the intact side (a, b), whereas the lesion/TH + GCH1 binding mimicked the binding of the intact side (c, d). Analysis of the data from in vivo [11C]raclopride PET scans expressed as BP to the striatal D2 DA receptors indicated a significant increase on the lesion side of the GFP-injected hemiparkinsonian rats and restoration of BP values to control values in the lesion side of the TH + GCH1-injected animals (e). To resolve the precise source of the change in BP, we calculated the apparent D2 DA receptor density (Bmax; f) and affinity of the binding to the receptors (KdVr − apparent in vivo Kd; g) by calculating the x-intercept and slope of the best-fit line from the quantitative PET dataset at the equilibrium state (12–50 min after injection; black symbols) and found that the changes were essentially attributable to a decrease in the KdVr and not an increase of the Bmax values. The in vivo estimates of BP, Bmax, and KdVr were tightly correlated to the corresponding in vitro values from the same animals (h–j). Statistics in e: two-way ANOVA, χ2(5,51) = 18.88, p < 0.005; g: two-way ANOVA, χ2(5,51) = 18.70, p < 0.005. The two-way analysis was followed by individual contrasts with Bonferroni's correction in both tests. Regression line fits in h–j are two-tailed significance of the Pearson's product-moment correlation coefficient. * indicates different from intact side; # indicates different from normal control.

