
Figure 1.
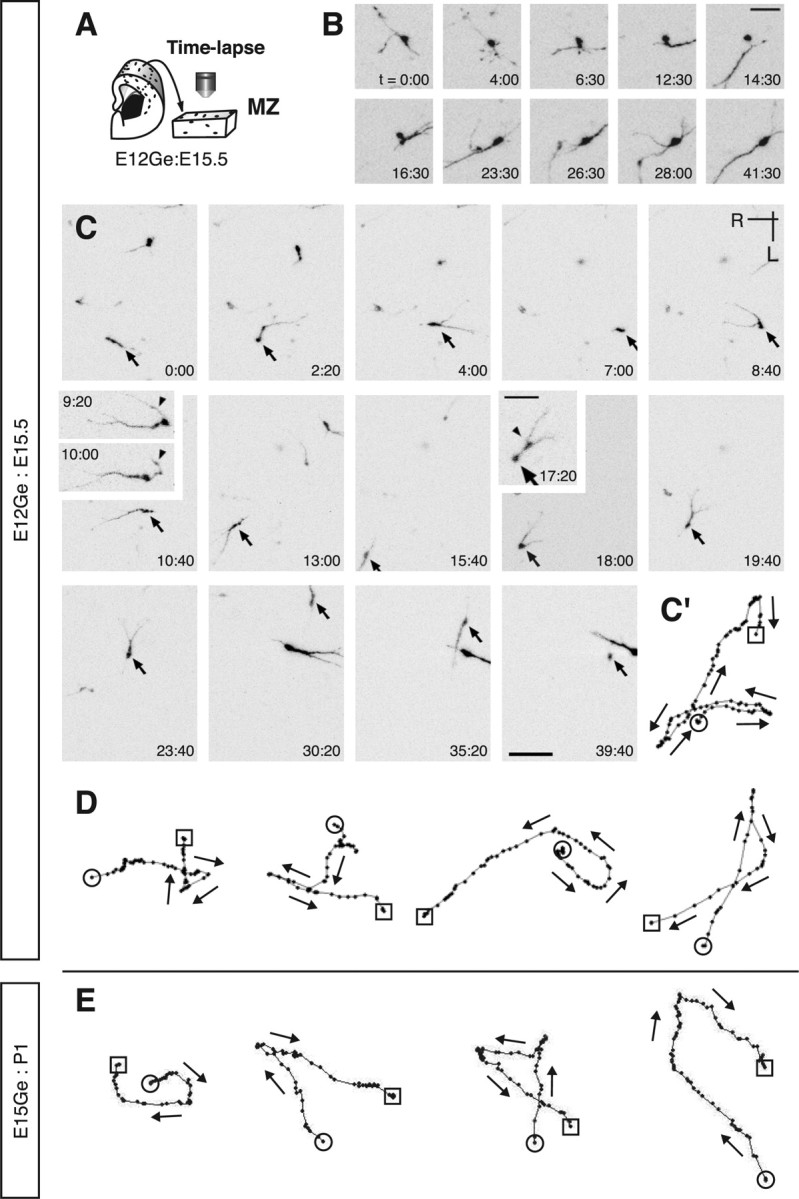
Interneurons exhibit a wide variety of behaviors in the MZ. A, Schematic of time-lapse imaging in a flat-mount cortex from E12Ge:E15.5 brains. B, Time-lapse sequence of a GFP cell showing stationary behavior. Although the soma was stationary, the processes dynamically extended and retracted during the observation period. The numbers in the bottom right corners indicate time. C, Time-lapse sequence of a GFP cell showing wandering behavior. Arrows indicate the same neuron at different time points. In frames 9:20 and 10:00, arrowheads indicates a leading process transforming into a trailing process. In frame 17:20, the arrow or arrowhead indicates a soma or a swelling, respectively. The numbers in the bottom right or top left corners indicate time. C′, Track of the cell indicated by the arrows in C. Each black dot illustrates the cell position plotted at 20 min intervals. The circle or square illustrates the initial or final position, respectively. Arrows indicate the direction of migration. D, E, Examples of cell tracks wandering in E12Ge:E15.5 (D) or E15Ge:P1 (E) cortices. Each black dot illustrates the cell position plotted at 30 min intervals. The circle or square illustrates the initial or final position, respectively. Arrows indicate the direction of migration. R, Rostral; L, lateral. Scale bars: B, 30 μm; C–E, 50 μm; C (insets), 25 μm.