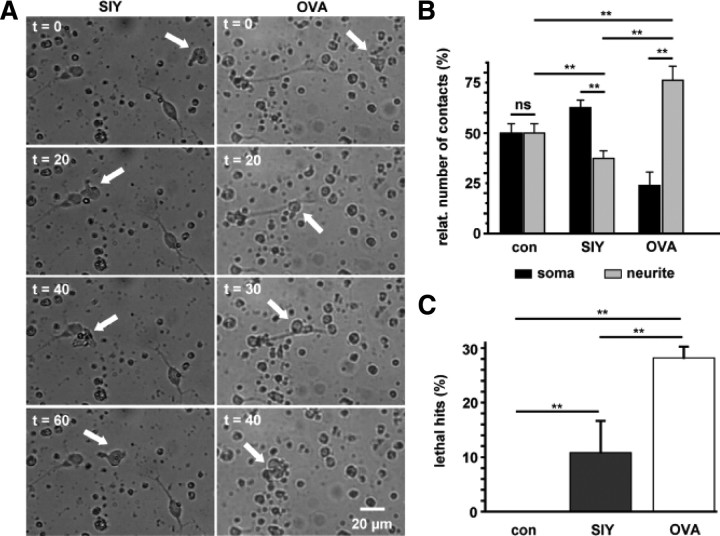
Figure 1.
Time-lapse video microscopy of OT-I T cell–neuron interactions. A, Migration and interaction of a stimulated OT-I T cell (white arrow) with a MHC I-expressing hippocampal neuron over 60 min in the presence of a control peptide (SIY, left column) and the appropriate OVA peptide (OVA, right column; see also corresponding video traces in Fig. 2A and supplemental Movies 1, 2, available at www.jneurosci.org as supplemental material). Scale bar, 20 μm (for all panels). B, Bar graph representation of T cell–neuron interaction sites [soma (black bars) vs neurites (gray bars)] under control conditions (con; n = 15) and after application of a control peptide (SIY; n = 23) or OVA peptide (OVA; n = 21). C, Percentage of T cell–neuron interactions leading to neuronal death as indicated by morphological changes (lethal hits) under control conditions (con; n = 15) and in the presence of a control peptide (SIY; n = 23) or OVA peptide (OVA; n = 21). Error bars represent mean ± SEM. **p < 0.05; ns, not significant.

