
Figure 5.
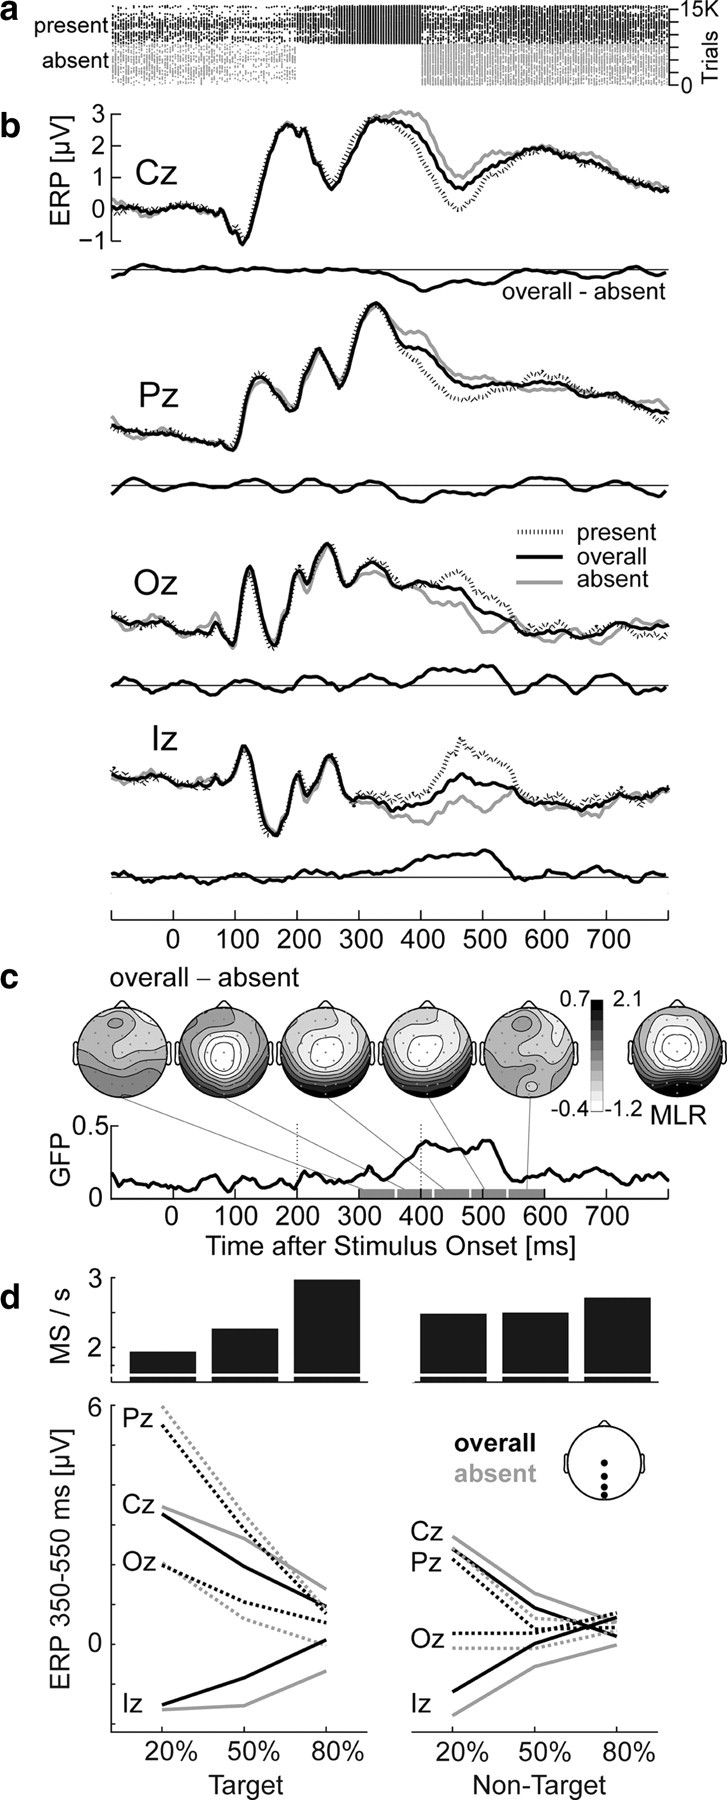
Stimulus-locked ERP in the oddball experiment as a function of microsaccade occurrence between 200 and 400 ms. a, Horizontal lines represent trials; dots mark microsaccades (MS). MS-present and MS-absent trials are plotted separately. b, ERP for MS-absent trials, MS-present trials, and the overall set of trials. Central electrodes show negative and occipital electrodes positive deflections in trials with microsaccades. Difference waves compare the ERP from all trials to that from MS-absent trials only. Note that experimental conditions are equally weighted in this plot, i.e., MS-absent, MS-present, and overall ERPs were first computed in each condition, and only then collapsed across conditions. c, Scalp topography and global field power of the microsaccade effect. Its topography (shown for 60 ms intervals between 300 and 600 ms) resembled the peak topography of the MLR (shown for comparison) and its latency reflected the delay between microsaccade onset and MLR peak. d, Mean microsaccade rate (between 200 and 400 ms) and ERP amplitude (350–550 ms) for the six conditions. In addition to P300 effects of targetness and stimulus frequency, ERP distortions from microsaccades are evident at all electrodes. For nontargets, both microsaccade rate and ERP distortions were similar for rare and frequent stimuli. For targets, distortions increased with increasing microsaccade rate at occipital electrodes.